


Module 09: Nonlinear Methods - Participation Exercises#
Exercise 9.1: Prediction - Method Selection#
Type: 🔮 Prediction (3 min)
For each scenario, predict which method would work best: Linear Regression, Polynomial Regression, Decision Tree, or k-Nearest Neighbors.
Scenario |
Your Choice |
Reasoning |
|---|---|---|
Predicting yield from temperature (Arrhenius-like) |
||
Classifying materials into 5 categories based on properties |
||
Predicting property with many step-changes/thresholds |
||
Predicting output from 100 features, most are noise |
Fill in the table above
Exercise 9.2: Mini-Exercise - Overfitting Visualization#
Type: 🔧 Mini-Exercise (7 min)
Visualize overfitting with polynomial regression.
import numpy as np
import matplotlib.pyplot as plt
from sklearn.preprocessing import PolynomialFeatures
from sklearn.linear_model import LinearRegression
from sklearn.pipeline import make_pipeline

# Generate noisy data from a simple quadratic
np.random.seed(42)
X = np.linspace(0, 1, 15).reshape(-1, 1)
y = 2*X.ravel()**2 - X.ravel() + 0.5 + np.random.randn(15)*0.1

X_plot = np.linspace(-0.1, 1.1, 100).reshape(-1, 1)

plt.figure(figsize=(15, 4))

# TASK: Try degrees 1, 2, and 15
# For each, plot the fit and observe what happens
for i, degree in enumerate([1, 2, 15]):
    plt.subplot(1, 3, i+1)

    model = make_pipeline(PolynomialFeatures(degree), LinearRegression())
    model.fit(X, y)

    plt.scatter(X, y, color='blue', label='Data')
    plt.plot(X_plot, model.predict(X_plot), color='red', label=f'Degree {degree}')
    plt.ylim(-0.5, 2)
    plt.title(f'Degree {degree}')
    plt.legend()

plt.tight_layout()
plt.show()

# QUESTION: Which degree is best? How do you know?
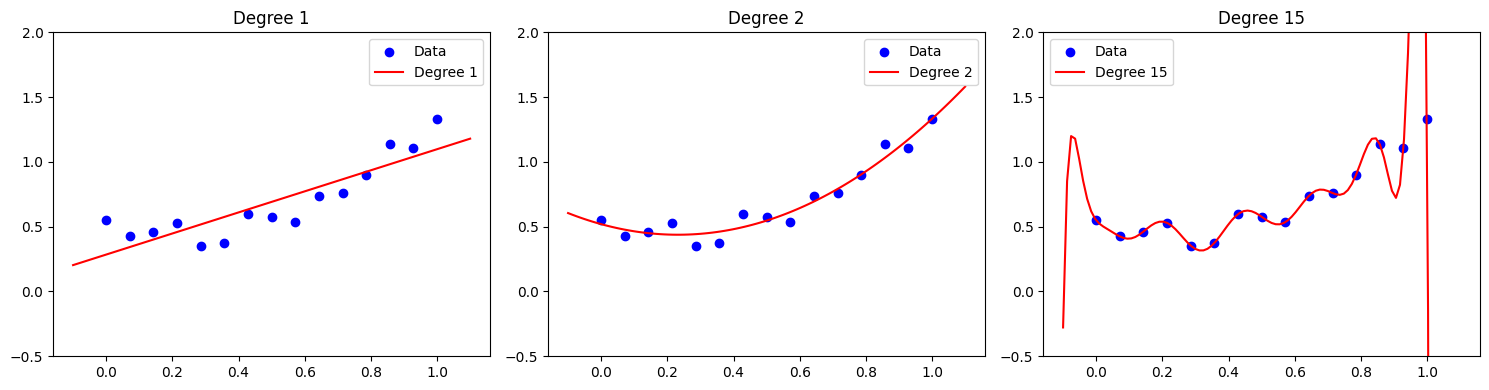
Your observation:
Exercise 9.3: Discussion - Interpretability vs Performance#
Type: 💬 Discussion (5 min)
You’re presenting model results to plant operators who need to understand why the model makes certain predictions.
Discuss:
Rank these models from most to least interpretable: Linear Regression, Random Forest, Neural Network, Decision Tree
When might you sacrifice interpretability for performance?
How could you make a black-box model more interpretable?
Discussion notes: