


Homework 8: Regularization and Model Selection#
Apply regularization techniques and model selection strategies.
import numpy as np
import pandas as pd
import matplotlib.pyplot as plt
from sklearn.linear_model import Ridge, Lasso, ElasticNet, LinearRegression
from sklearn.model_selection import train_test_split, cross_val_score, GridSearchCV
from sklearn.preprocessing import StandardScaler, PolynomialFeatures
from sklearn.metrics import mean_squared_error, r2_score
Problem 1: Overfitting Demonstration#
See how polynomial degree affects overfitting.
# Load polynomial data from URL
url = "https://raw.githubusercontent.com/jkitchin/s26-06642/main/dsmles/data/hw08_polynomial.csv"
poly_data = pd.read_csv(url)
X = poly_data['x'].values.reshape(-1, 1)
y = poly_data['y'].values

X_train, X_test, y_train, y_test = train_test_split(X, y, test_size=0.3, random_state=42)

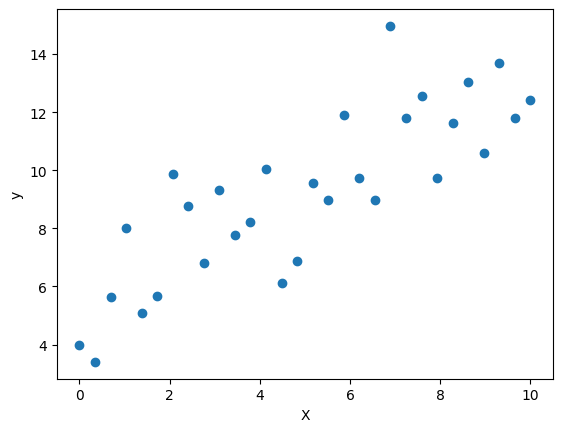
plt.scatter(X, y)
plt.xlabel('X')
plt.ylabel('y')
plt.show()
1a. Fit polynomial models of degree 1, 2, 5, and 15. Report train and test R² for each.
# Your code here
1b. Plot all four fitted curves on the same graph with the data. Which model overfits?
# Your code here
1c. What happens to the coefficient magnitudes as polynomial degree increases? Show examples.
# Your code here
Problem 2: Ridge and Lasso#
Apply regularization to a high-dimensional problem.
# Load sparse features data from URL
url = "https://raw.githubusercontent.com/jkitchin/s26-06642/main/dsmles/data/hw08_sparse_features.csv"
sparse_data = pd.read_csv(url)

# Extract features and target
feature_cols = [col for col in sparse_data.columns if col.startswith('feature_')]
X = sparse_data[feature_cols].values
y = sparse_data['target'].values
p = X.shape[1]
n = X.shape[0]

X_train, X_test, y_train, y_test = train_test_split(X, y, test_size=0.3, random_state=42)

print(f"Features: {p}, Samples: {n}")
print(f"True non-zero coefficients: 5 (first 5 features)")
Features: 50, Samples: 100
True non-zero coefficients: 5 (first 5 features)
2a. Fit ordinary linear regression. What is the test R²? How many coefficients are large (>0.1)?
# Your code here
2b. Use GridSearchCV to find the best alpha for Ridge regression (try alphas from 0.01 to 100). Report the best alpha and test R².
# Your code here
2c. Do the same for Lasso. How many coefficients are exactly zero?
# Your code here
2d. Compare the estimated coefficients from Lasso to the true coefficients. Did Lasso identify the correct features?
# Your code here
Problem 3: Model Selection#
3a. Plot the cross-validation score vs alpha for both Ridge and Lasso on the same graph. What do you observe?
# Your code here
3b. When would you choose Ridge over Lasso? When would you choose Lasso?
Your answer here:
3c. A colleague says “I got R²=0.99 on my training data, so my model is great!” What’s wrong with this reasoning?
Your answer here: