


Homework 11: Clustering#
Apply clustering methods to discover patterns in chemical data.
import numpy as np
import pandas as pd
import matplotlib.pyplot as plt
from sklearn.cluster import KMeans, DBSCAN, AgglomerativeClustering
from sklearn.preprocessing import StandardScaler
from sklearn.metrics import silhouette_score
from scipy.cluster.hierarchy import dendrogram, linkage
Problem 1: K-Means Clustering#
Cluster process operating conditions to identify operating regimes.
# Load operating regimes data from URL
url = "https://raw.githubusercontent.com/jkitchin/s26-06642/main/dsmles/data/hw11_operating_regimes.csv"
op_data = pd.read_csv(url)

plt.scatter(op_data['temperature'], op_data['pressure'], alpha=0.6)
plt.xlabel('Temperature (K)')
plt.ylabel('Pressure (atm)')
plt.title('Process Operating Points')
plt.show()
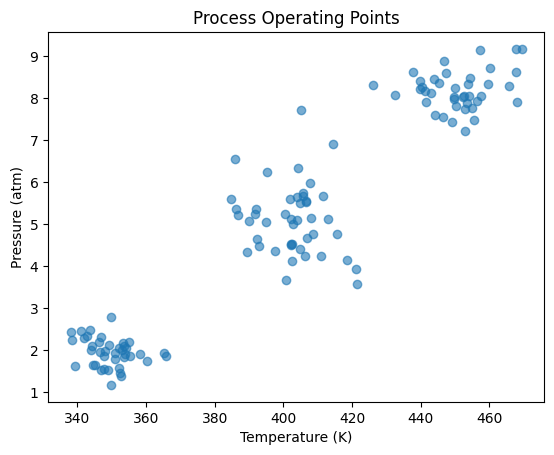
1a. Scale the data and apply K-Means with k=3. Plot the results colored by cluster.
# Your code here
1b. Use the elbow method to determine the optimal number of clusters. Plot inertia vs k for k=1 to 8.
# Your code here
1c. Calculate the silhouette score for k=2, 3, 4, 5. Which k gives the best score?
# Your code here
1d. Report the cluster centers (in original units). What do they represent physically?
# Your code here
Problem 2: Hierarchical Clustering#
Analyze catalyst similarity.
# Load catalyst properties data from URL
url = "https://raw.githubusercontent.com/jkitchin/s26-06642/main/dsmles/data/hw11_catalyst_samples.csv"
catalyst_props = pd.read_csv(url)
catalyst_props.head()
| surface_area | pore_volume | acidity | |
|---|---|---|---|
| 0 | 250 | 0.80 | 1.20 |
| 1 | 255 | 0.82 | 1.25 |
| 2 | 245 | 0.78 | 1.18 |
| 3 | 260 | 0.85 | 1.30 |
| 4 | 248 | 0.79 | 1.22 |
2a. Create a dendrogram using Ward linkage. How many natural clusters do you see?
# Your code here
2b. Apply Agglomerative Clustering to get 3 clusters. Which catalysts are in each cluster?
# Your code here
2c. Describe the characteristics of each cluster (e.g., “high surface area, high pore volume”).
# Your code here
Problem 3: DBSCAN and Outliers#
Identify anomalous batches.
# Load batch data with outliers from URL
url = "https://raw.githubusercontent.com/jkitchin/s26-06642/main/dsmles/data/hw11_outlier_data.csv"
batch_data = pd.read_csv(url)

plt.scatter(batch_data['conversion'], batch_data['selectivity'], alpha=0.6)
plt.xlabel('Conversion (%)')
plt.ylabel('Selectivity (%)')
plt.show()
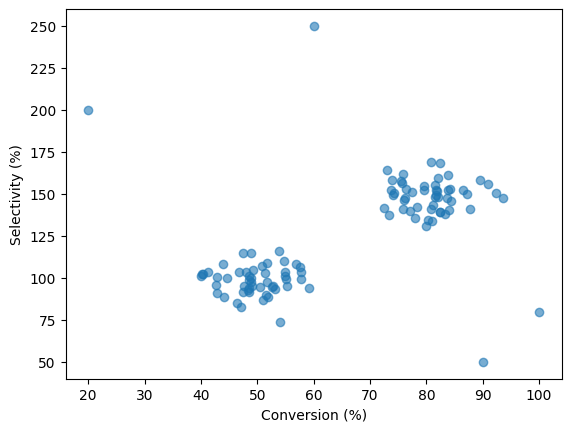
3a. Apply DBSCAN with eps=0.5 and min_samples=5 to scaled data. How many outliers (label=-1) are detected?
# Your code here
3b. Plot the results with outliers highlighted in a different color.
# Your code here
3c. When would you use DBSCAN vs K-Means for clustering process data?
Your answer here: