


Homework 12: Uncertainty Quantification#
Quantify and communicate uncertainty in model predictions.
import numpy as np
import pandas as pd
import matplotlib.pyplot as plt
from sklearn.linear_model import LinearRegression
from sklearn.ensemble import RandomForestRegressor, GradientBoostingRegressor
from sklearn.model_selection import train_test_split, cross_val_predict
from pycse import regress
import scipy.stats as stats
Problem 1: Confidence Intervals for Linear Regression#
Quantify uncertainty in regression parameters and predictions.
# Load Arrhenius data from URL
url = "https://raw.githubusercontent.com/jkitchin/s26-06642/main/dsmles/data/hw12_arrhenius.csv"
arr_data = pd.read_csv(url)
T = arr_data['temperature'].values
rate = arr_data['rate_constant'].values

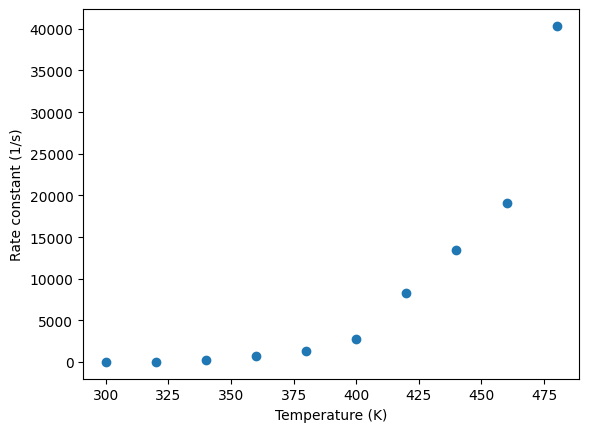
plt.scatter(T, rate)
plt.xlabel('Temperature (K)')
plt.ylabel('Rate constant (1/s)')
plt.show()
1a. Use pycse.regress to fit a linear model. Report the slope with its 95% confidence interval.
# Your code here
1b. Calculate and plot the 95% confidence band for the fitted line.
# Your code here
1c. Predict the rate at T=500 K with a 95% prediction interval. Why is the prediction interval wider than the confidence interval?
# Your code here
1d. Is extrapolating to T=600 K reliable? Use the confidence interval width to justify your answer.
# Your code here
Problem 2: Bootstrap Uncertainty#
Estimate uncertainty for complex models using bootstrap.
# Load 2D regression data from URL
url = "https://raw.githubusercontent.com/jkitchin/s26-06642/main/dsmles/data/hw12_2d_regression.csv"
reg_data = pd.read_csv(url)
X = reg_data[['x1', 'x2']].values
y = reg_data['y'].values

print(f"Data shape: {X.shape}")
Data shape: (50, 2)
2a. Implement bootstrap to estimate the 95% confidence interval for Random Forest predictions. Use 100 bootstrap samples.
# Your code here
# Hint: For each bootstrap sample:
# 1. Sample with replacement from the data
# 2. Train a model on the bootstrap sample
# 3. Make predictions on a test point
# 4. Store the predictions
# Then calculate percentiles across all bootstrap predictions
2b. For a test point X=[5, 5], report the mean prediction and 95% bootstrap CI.
# Your code here
2c. Compare the bootstrap CI width for points inside the training range (X=[5,5]) vs outside (X=[12,12]). What do you observe?
# Your code here
Problem 3: Model Uncertainty Communication#
3a. A model predicts yield = 85% ± 3%. Explain what this means to a plant operator who needs to decide whether to run a batch.
Your answer here:
3b. Your model has high uncertainty (wide prediction intervals) for a particular region of operating conditions. What does this suggest about what data you should collect next?
Your answer here:
3c. You’re choosing between two models: Model A has RMSE=2.0 with narrow CIs, Model B has RMSE=1.8 but the CIs don’t include the true values 30% of the time. Which would you prefer for making decisions? Why?
Your answer here: