


Homework 5: Dimensionality Reduction#
Apply PCA and t-SNE to chemical engineering data.
import numpy as np
import pandas as pd
import matplotlib.pyplot as plt
from sklearn.preprocessing import StandardScaler
from sklearn.decomposition import PCA
from sklearn.manifold import TSNE
Problem 1: PCA Basics#
Analyze spectroscopic data from polymer samples.
# Load spectroscopic data from URL
url = "https://raw.githubusercontent.com/jkitchin/s26-06642/main/dsmles/data/hw05_spectroscopic_data.csv"
spectra_df = pd.read_csv(url)

# Extract spectra and metadata
wavelength_cols = [col for col in spectra_df.columns if col.startswith('wl_')]
spectra = spectra_df[wavelength_cols].values
concentration = spectra_df['concentration'].values
temperature = spectra_df['temperature'].values
wavelengths = np.array([int(col.split('_')[1]) for col in wavelength_cols])

print(f"Data shape: {spectra.shape}")
plt.figure(figsize=(10, 4))
for i in range(5):
    plt.plot(wavelengths, spectra[i], alpha=0.7)
plt.xlabel('Wavelength (nm)')
plt.ylabel('Absorbance')
plt.title('Sample Spectra')
plt.show()
Data shape: (100, 50)
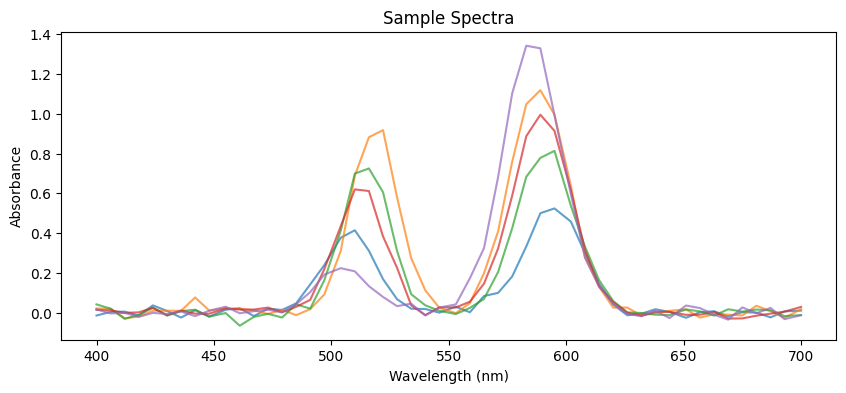
1a. Scale the spectral data and perform PCA. How many components explain 95% of the variance?
# Your code here
1b. Plot the cumulative explained variance ratio. Create a scree plot.
# Your code here
1c. Plot the first two principal component loadings. What wavelength regions are most important for each component?
# Your code here
1d. Create a scatter plot of PC1 vs PC2, colored by concentration. Is there a relationship?
# Your code here
Problem 2: t-SNE Visualization#
Visualize clusters in high-dimensional data.
# Load catalyst properties data from URL
url = "https://raw.githubusercontent.com/jkitchin/s26-06642/main/dsmles/data/hw05_catalyst_properties.csv"
catalyst_df = pd.read_csv(url)

# Extract property columns and labels
property_cols = [col for col in catalyst_df.columns if col.startswith('prop')]
catalyst_properties = catalyst_df[property_cols].values
catalyst_labels = catalyst_df['catalyst_type'].tolist()

print(f"Data shape: {catalyst_properties.shape}")
Data shape: (150, 0)
2a. Apply t-SNE with perplexity=30. Plot the results colored by catalyst type.
# Your code here
2b. How does perplexity affect the result? Compare perplexity=5, 30, and 50.
# Your code here
2c. Compare t-SNE to PCA for this dataset. Which method better separates the catalyst types?
# Your code here
Problem 3: Interpretation#
3a. A colleague wants to use PCA to reduce 100 process variables to 10 for a predictive model. What questions should they consider before doing this?
Your answer here:
3b. Why can’t you use t-SNE embeddings as features for a predictive model on new data?
Your answer here:
3c. You have spectral data from 1000 wavelengths and want to predict concentration. Would you use PCA, t-SNE, or neither for preprocessing? Explain.
Your answer here: