Solving CSTR design equations

| categories: nonlinear algebra | tags: reaction engineering

Given a continuously stirred tank reactor with a volume of 66,000 dm^3 where the reaction \(A \rightarrow B\) occurs, at a rate of \(-r_A = k C_A^2\) (\(k=3\) L/mol/h), with an entering molar flow of F_{A0} = 5 mol/h and a volumetric flowrate of 10 L/h, what is the exit concentration of A?

From a mole balance we know that at steady state \(0 = F_{A0} - F_A + V r_A\). That equation simply states the sum of the molar flow of A in in minus the molar flow of A out plus the molar rate A is generated is equal to zero at steady state. This is directly the equation we need to solve. We need the following relationship:

  1. \(F_A = v0 C_A\)
from scipy.optimize import fsolve

Fa0 = 5.0
v0 = 10.

V = 66000.0  # reactor volume L^3
k = 3.0      # rate constant L/mol/h

def func(Ca):
    "Mole balance for a CSTR. Solve this equation for func(Ca)=0"
    Fa = v0 * Ca     # exit molar flow of A
    ra = -k * Ca**2  # rate of reaction of A L/mol/h
    return Fa0 - Fa + V * ra

# CA guess that that 90 % is reacted away
CA_guess = 0.1 * Fa0 / v0
CA_sol, = fsolve(func, CA_guess)

print 'The exit concentration is {0} mol/L'.format(CA_sol)
The exit concentration is 0.005 mol/L

It is a little confusing why it is necessary to put a comma after the CA_sol in the fsolve command. If you do not put it there, you get brackets around the answer.

Copyright (C) 2013 by John Kitchin. See the License for information about copying.

org-mode source

Discuss on Twitter

Integrating the batch reactor mole balance

| categories: ode | tags: reaction engineering

An alternative approach of evaluating an integral is to integrate a differential equation. For the batch reactor, the differential equation that describes conversion as a function of time is:

\(\frac{dX}{dt} = -r_A V/N_{A0}\).

Given a value of initial concentration, or volume and initial number of moles of A, we can integrate this ODE to find the conversion at some later time. We assume that \(X(t=0)=0\). We will integrate the ODE over a time span of 0 to 10,000 seconds.

from scipy.integrate import odeint
import numpy as np
import matplotlib.pyplot as plt

k = 1.0e-3
Ca0 = 1.0  # mol/L

def func(X, t):
    ra = -k * (Ca0 * (1 - X))**2
    return -ra / Ca0

X0 = 0
tspan = np.linspace(0,10000)

sol = odeint(func, X0, tspan)
plt.plot(tspan,sol)
plt.xlabel('Time (sec)')
plt.ylabel('Conversion')
plt.savefig('images/2013-01-06-batch-conversion.png')

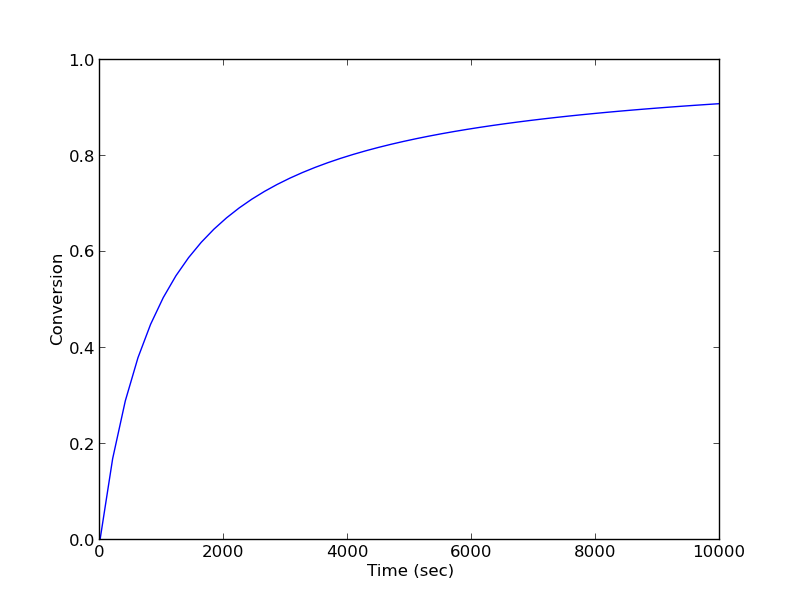
You can read off of this figure to find the time required to achieve a particular conversion.

Copyright (C) 2013 by John Kitchin. See the License for information about copying.

org-mode source

Discuss on Twitter

Numerically calculating an effectiveness factor for a porous catalyst bead

| categories: bvp | tags: reaction engineering

Matlab post

If reaction rates are fast compared to diffusion in a porous catalyst pellet, then the observed kinetics will appear to be slower than they really are because not all of the catalyst surface area will be effectively used. For example, the reactants may all be consumed in the near surface area of a catalyst bead, and the inside of the bead will be unutilized because no reactants can get in due to the high reaction rates.

References: Ch 12. Elements of Chemical Reaction Engineering, Fogler, 4th edition.

A mole balance on the particle volume in spherical coordinates with a first order reaction leads to: $\frac{d^2Ca}{dr^2} + \frac{2}{r}\frac{dCa}{dr}-\frac{k}{D_e}C_A=0$ with boundary conditions $C_A(R) = C_{As}$ and $\frac{dCa}{dr}=0$ at $r=0$. We convert this equation to a system of first order ODEs by letting $W_A=\frac{dCa}{dr}$. Then, our two equations become:

\(\frac{dCa}{dr} = W_A\)

and

\(\frac{dW_A}{dr} = -\frac{2}{r} W_A + \frac{k}{D_E} C_A\)

We have a condition of no flux ($W_A=0$) at r=0 and Ca(R) = CAs, which makes this a boundary value problem. We use the shooting method here, and guess what Ca(0) is and iterate the guess to get Ca(R) = CAs.

The value of the second differential equation at r=0 is tricky because at this place we have a 0/0 term. We use L'Hopital's rule to evaluate it. The derivative of the top is $\frac{dW_A}{dr}$ and the derivative of the bottom is 1. So, we have \(\frac{dW_A}{dr} = -2\frac{dW_A}{dr} + \frac{k}{D_E} C_A\)

Which leads to:

\(3 \frac{dW_A}{dr} =  \frac{k}{D_E} C_A\)

or \(\frac{dW_A}{dr} =  \frac{3k}{D_E} C_A\) at $r=0$.

Finally, we implement the equations in Python and solve.

import numpy as np
from scipy.integrate import odeint
import matplotlib.pyplot as plt

De = 0.1    # diffusivity cm^2/s
R = 0.5    # particle radius, cm
k = 6.4    # rate constant (1/s)
CAs = 0.2   # concentration of A at outer radius of particle (mol/L)


def ode(Y, r):
    Wa = Y[0]  # molar rate of delivery of A to surface of particle
    Ca = Y[1]  # concentration of A in the particle at r
    # this solves the singularity at r = 0
    if r == 0:
        dWadr = k / 3.0 * De * Ca
    else:
        dWadr = -2 * Wa / r + k / De * Ca
    dCadr = Wa
    return [dWadr, dCadr]

# Initial conditions
Ca0 = 0.029315  # Ca(0) (mol/L) guessed to satisfy Ca(R) = CAs
Wa0 = 0         # no flux at r=0 (mol/m^2/s)

rspan = np.linspace(0, R, 500)

Y = odeint(ode, [Wa0, Ca0], rspan)

Ca = Y[:, 1]

# here we check that Ca(R) = Cas
print 'At r={0} Ca={1}'.format(rspan[-1], Ca[-1])

plt.plot(rspan, Ca)
plt.xlabel('Particle radius')
plt.ylabel('$C_A$')
plt.savefig('images/effectiveness-factor.png')

r = rspan
eta_numerical = (np.trapz(k * Ca * 4 * np.pi * (r**2), r)
                 / np.trapz(k * CAs * 4 * np.pi * (r**2), r))

print(eta_numerical)

phi = R * np.sqrt(k / De)
eta_analytical = (3 / phi**2) * (phi * (1.0 / np.tanh(phi)) - 1)
print(eta_analytical)
At r=0.5 Ca=0.200001488652
[<matplotlib.lines.Line2D object at 0x114275550>]
<matplotlib.text.Text object at 0x10d5fe890>
<matplotlib.text.Text object at 0x10d5ff890>
0.563011348314

0.563003362801

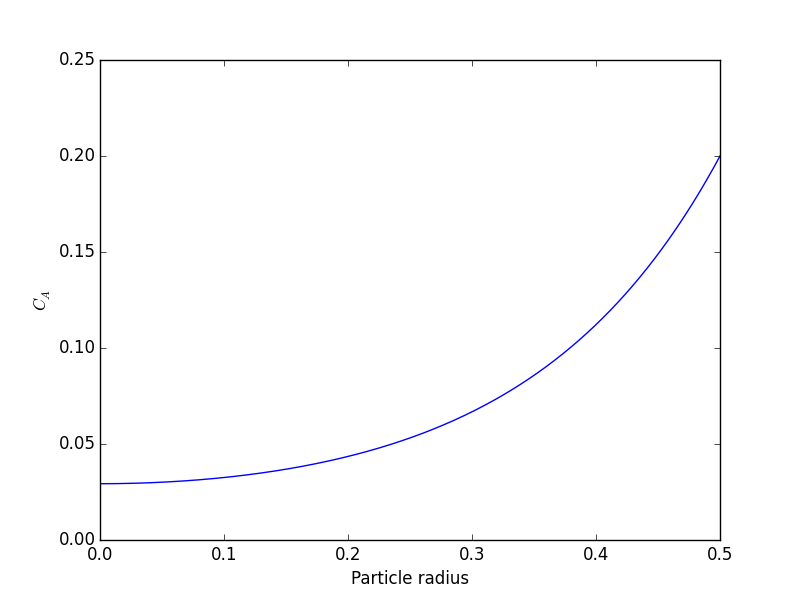
You can see the concentration of A inside the particle is significantly lower than outside the particle. That is because it is reacting away faster than it can diffuse into the particle. Hence, the overall reaction rate in the particle is lower than it would be without the diffusion limit.

The effectiveness factor is the ratio of the actual reaction rate in the particle with diffusion limitation to the ideal rate in the particle if there was no concentration gradient:

$$\eta = \frac{\int_0^R k'' a C_A(r) 4 \pi r^2 dr}{\int_0^R k'' a C_{As} 4 \pi r^2 dr}$$

We will evaluate this numerically from our solution and compare it to the analytical solution. The results are in good agreement, and you can make the numerical estimate better by increasing the number of points in the solution so that the numerical integration is more accurate.

Why go through the numerical solution when an analytical solution exists? The analytical solution here is only good for 1st order kinetics in a sphere. What would you do for a complicated rate law? You might be able to find some limiting conditions where the analytical equation above is relevant, and if you are lucky, they are appropriate for your problem. If not, it is a good thing you can figure this out numerically!

Thanks to Radovan Omorjan for helping me figure out the ODE at r=0!

Copyright (C) 2015 by John Kitchin. See the License for information about copying.

org-mode source

Org-mode version = 8.2.10
Discuss on Twitter

Solving parameterized ODEs over and over conveniently

| categories: ode | tags: reaction engineering

Matlab post Sometimes we have an ODE that depends on a parameter, and we want to solve the ODE for several parameter values. It is inconvenient to write an ode function for each parameter case. Here we examine a convenient way to solve this problem; we pass the parameter to the ODE at runtime. We consider the following ODE:

$$\frac{dCa}{dt} = -k Ca(t)$$

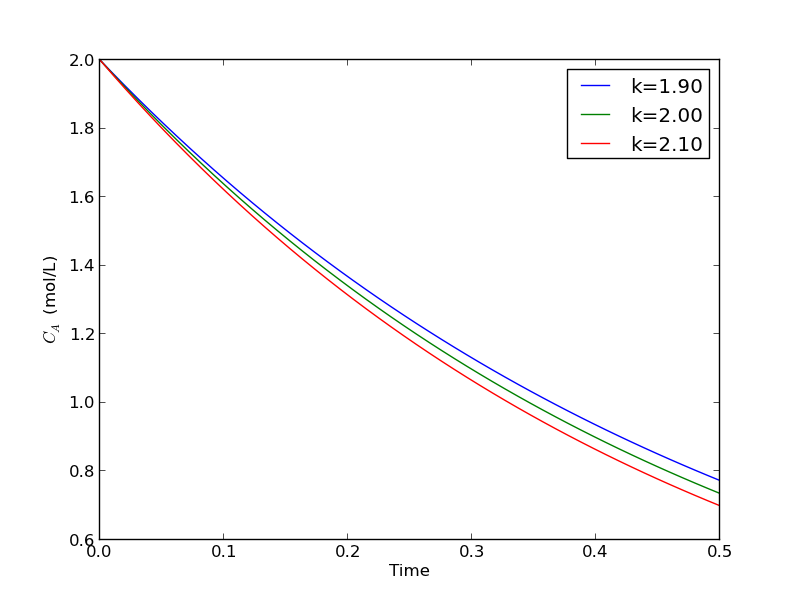
where \(k\) is a parameter, and we want to solve the equation for a couple of values of \(k\) to test the sensitivity of the solution on the parameter. Our question is, given \(Ca(t=0)=2\), how long does it take to get \(Ca = 1\), and how sensitive is the answer to small variations in \(k\)?

import numpy as np
from scipy.integrate import odeint
import matplotlib.pyplot as plt

def myode(Ca, t, k):
    'ODE definition'
    dCadt = -k * Ca
    return dCadt

tspan = np.linspace(0, 0.5)
k0 = 2
Ca0 = 2

plt.figure(); plt.clf()

for k in [0.95 * k0, k0, 1.05 * k0]:
    sol = odeint(myode, Ca0, tspan, args=(k,))
    plt.plot(tspan, sol, label='k={0:1.2f}'.format(k))
    print 'At t=0.5 Ca = {0:1.2f} mol/L'.format(sol[-1][0])

plt.legend(loc='best')
plt.xlabel('Time')
plt.ylabel('$C_A$ (mol/L)')
plt.savefig('images/parameterized-ode1.png')
At t=0.5 Ca = 0.77 mol/L
At t=0.5 Ca = 0.74 mol/L
At t=0.5 Ca = 0.70 mol/L

You can see there are some variations in the concentration at t = 0.5. You could over or underestimate the concentration if you have the wrong estimate of $k$! You have to use some judgement here to decide how long to run the reaction to ensure a target goal is met.

Copyright (C) 2013 by John Kitchin. See the License for information about copying.

org-mode source

Discuss on Twitter

Constrained minimization to find equilibrium compositions

| categories: optimization | tags: reaction engineering, thermodynamics

adapated from Chemical Reactor analysis and design fundamentals, Rawlings and Ekerdt, appendix A.2.3.

Matlab post

The equilibrium composition of a reaction is the one that minimizes the total Gibbs free energy. The Gibbs free energy of a reacting ideal gas mixture depends on the mole fractions of each species, which are determined by the initial mole fractions of each species, the extent of reactions that convert each species, and the equilibrium constants.

Reaction 1: \(I + B \rightleftharpoons P1\)

Reaction 2: \(I + B \rightleftharpoons P2\)

Here we define the Gibbs free energy of the mixture as a function of the reaction extents.

import numpy as np

def gibbs(E):
    'function defining Gibbs free energy as a function of reaction extents'
    e1 = E[0]
    e2 = E[1]
    # known equilibrium constants and initial amounts
    K1 = 108; K2 = 284; P = 2.5
    yI0 = 0.5; yB0 = 0.5; yP10 = 0.0; yP20 = 0.0
    # compute mole fractions
    d = 1 - e1 - e2
    yI = (yI0 - e1 - e2) / d
    yB = (yB0 - e1 - e2) / d
    yP1 = (yP10 + e1) / d
    yP2 = (yP20 + e2) / d
    G = (-(e1 * np.log(K1) + e2 * np.log(K2)) +
         d * np.log(P) + yI * d * np.log(yI) +
         yB * d * np.log(yB) + yP1 * d * np.log(yP1) + yP2 * d * np.log(yP2))
    return G

The equilibrium constants for these reactions are known, and we seek to find the equilibrium reaction extents so we can determine equilibrium compositions. The equilibrium reaction extents are those that minimize the Gibbs free energy. We have the following constraints, written in standard less than or equal to form:

\(-\epsilon_1 \le 0\)

\(-\epsilon_2 \le 0\)

\(\epsilon_1 + \epsilon_2 \le 0.5\)

In Matlab we express this in matrix form as Ax=b where

\begin{equation} A = \left[ \begin{array}{cc} -1 & 0 \\ 0 & -1 \\ 1 & 1 \end{array} \right] \end{equation}

and

\begin{equation} b = \left[ \begin{array}{c} 0 \\ 0 \\ 0.5\end{array} \right] \end{equation}

Unlike in Matlab, in python we construct the inequality constraints as functions that are greater than or equal to zero when the constraint is met.

def constraint1(E):
    e1 = E[0]
    return e1


def constraint2(E):
    e2 = E[1]
    return e2


def constraint3(E):
    e1 = E[0]
    e2 = E[1]
    return 0.5 - (e1 + e2)

Now, we minimize.

from scipy.optimize import fmin_slsqp

X0 = [0.2, 0.2]
X = fmin_slsqp(gibbs, X0, ieqcons=[constraint1, constraint2, constraint3],
               bounds=((0.001, 0.499),
                       (0.001, 0.499)))
print(X)

print(gibbs(X))
Optimization terminated successfully.    (Exit mode 0)
            Current function value: -2.55942394906
            Iterations: 7
            Function evaluations: 31
            Gradient evaluations: 7
[ 0.13336503  0.35066486]
-2.55942394906

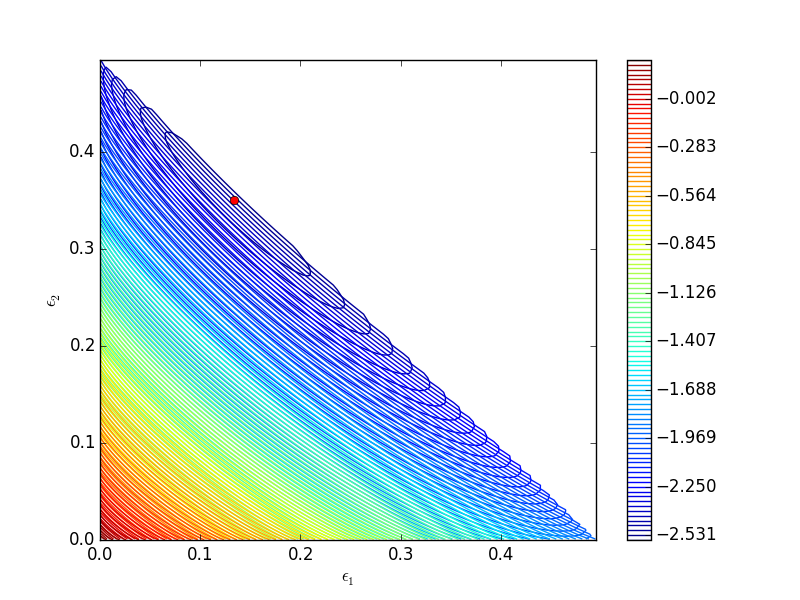
One way we can verify our solution is to plot the gibbs function and see where the minimum is, and whether there is more than one minimum. We start by making grids over the range of 0 to 0.5. Note we actually start slightly above zero because at zero there are some numerical imaginary elements of the gibbs function or it is numerically not defined since there are logs of zero there. We also set all elements where the sum of the two extents is greater than 0.5 to near zero, since those regions violate the constraints.

import numpy as np
import matplotlib.pyplot as plt

def gibbs(E):
    'function defining Gibbs free energy as a function of reaction extents'
    e1 = E[0]
    e2 = E[1]
    # known equilibrium constants and initial amounts
    K1 = 108; K2 = 284; P = 2.5;
    yI0 = 0.5; yB0 = 0.5; yP10 = 0.0; yP20 = 0.0;
    # compute mole fractions
    d = 1 - e1 - e2;
    yI = (yI0 - e1 - e2)/d;
    yB = (yB0 - e1 - e2)/d;
    yP1 = (yP10 + e1)/d;
    yP2 = (yP20 + e2)/d;
    G = (-(e1 * np.log(K1) + e2 * np.log(K2)) +
         d * np.log(P) + yI * d * np.log(yI) +
         yB * d * np.log(yB) + yP1 * d * np.log(yP1) + yP2 * d * np.log(yP2))
    return G


a = np.linspace(0.001, 0.5, 100)
E1, E2 = np.meshgrid(a,a)

sumE = E1 + E2
E1[sumE >= 0.5] = 0.00001
E2[sumE >= 0.5] = 0.00001

# now evaluate gibbs
G = np.zeros(E1.shape)
m,n = E1.shape

G = gibbs([E1, E2])

CS = plt.contour(E1, E2, G, levels=np.linspace(G.min(),G.max(),100))
plt.xlabel('$\epsilon_1$')
plt.ylabel('$\epsilon_2$')
plt.colorbar()

plt.plot([0.13336503],  [0.35066486], 'ro')

plt.savefig('images/gibbs-minimization-1.png')
plt.savefig('images/gibbs-minimization-1.svg')
plt.show()

You can see we found the minimum. We can compute the mole fractions pretty easily.

e1 = X[0];
e2 = X[1];

yI0 = 0.5; yB0 = 0.5; yP10 = 0; yP20 = 0; #initial mole fractions

d = 1 - e1 - e2;
yI = (yI0 - e1 - e2) / d
yB = (yB0 - e1 - e2) / d
yP1 = (yP10 + e1) / d
yP2 = (yP20 + e2) / d

print('y_I = {0:1.3f} y_B = {1:1.3f} y_P1 = {2:1.3f} y_P2 = {3:1.3f}'.format(yI,yB,yP1,yP2))
y_I = 0.031 y_B = 0.031 y_P1 = 0.258 y_P2 = 0.680

1 summary

I found setting up the constraints in this example to be more confusing than the Matlab syntax.

Copyright (C) 2016 by John Kitchin. See the License for information about copying.

org-mode source

Org-mode version = 8.2.10

Discuss on Twitter
« Previous Page -- Next Page »