Water gas shift equilibria via the NIST Webbook

| categories: nonlinear algebra | tags:

Matlab post

The NIST webbook provides parameterized models of the enthalpy, entropy and heat capacity of many molecules. In this example, we will examine how to use these to compute the equilibrium constant for the water gas shift reaction \(CO + H_2O \rightleftharpoons CO_2 + H_2\) in the temperature range of 500K to 1000K.

Parameters are provided for:

Cp = heat capacity (J/mol*K) H = standard enthalpy (kJ/mol) S = standard entropy (J/mol*K)

with models in the form: \(Cp^\circ = A + B*t + C*t^2 + D*t^3 + E/t^2\)

\(H^\circ - H^\circ_{298.15}= A*t + B*t^2/2 + C*t^3/3 + D*t^4/4 - E/t + F - H\)

\(S^\circ = A*ln(t) + B*t + C*t^2/2 + D*t^3/3 - E/(2*t^2) + G\)

where \(t=T/1000\), and \(T\) is the temperature in Kelvin. We can use this data to calculate equilibrium constants in the following manner. First, we have heats of formation at standard state for each compound; for elements, these are zero by definition, and for non-elements, they have values available from the NIST webbook. There are also values for the absolute entropy at standard state. Then, we have an expression for the change in enthalpy from standard state as defined above, as well as the absolute entropy. From these we can derive the reaction enthalpy, free energy and entropy at standard state, as well as at other temperatures.

We will examine the water gas shift enthalpy, free energy and equilibrium constant from 500K to 1000K, and finally compute the equilibrium composition of a gas feed containing 5 atm of CO and H_2 at 1000K.

import numpy as np

T = np.linspace(500,1000) # degrees K
t = T/1000;

1 hydrogen

\url{http://webbook.nist.gov/cgi/cbook.cgi?ID=C1333740&Units=SI&Mask=1#Thermo-Gas}

# T = 298-1000K valid temperature range
A =  33.066178
B = -11.363417
C =  11.432816
D = -2.772874
E = -0.158558
F = -9.980797
G =  172.707974
H =  0.0

Hf_29815_H2 = 0.0 # kJ/mol
S_29815_H2 = 130.68 # J/mol/K

dH_H2 = A*t + B*t**2/2 + C*t**3/3 + D*t**4/4 - E/t + F - H;
S_H2 = (A*np.log(t) + B*t + C*t**2/2 + D*t**3/3 - E/(2*t**2) + G);

2 H_{2}O

\url{http://webbook.nist.gov/cgi/cbook.cgi?ID=C7732185&Units=SI&Mask=1#Thermo-Gas}

Note these parameters limit the temperature range we can examine, as these parameters are not valid below 500K. There is another set of parameters for lower temperatures, but we do not consider them here.

# 500-1700 K valid temperature range
A =   30.09200
B =   6.832514
C =   6.793435
D =  -2.534480
E =   0.082139
F =  -250.8810
G =   223.3967
H =  -241.8264

Hf_29815_H2O = -241.83 #this is Hf.
S_29815_H2O = 188.84

dH_H2O = A*t + B*t**2/2 + C*t**3/3 + D*t**4/4 - E/t + F - H;
S_H2O = (A*np.log(t) + B*t + C*t**2/2 + D*t**3/3 - E/(2*t**2) + G);

3 CO

\url{http://webbook.nist.gov/cgi/cbook.cgi?ID=C630080&Units=SI&Mask=1#Thermo-Gas}

# 298. - 1300K valid temperature range
A =   25.56759
B =   6.096130
C =   4.054656
D =  -2.671301
E =   0.131021
F =  -118.0089
G =   227.3665
H = -110.5271

Hf_29815_CO = -110.53 #this is Hf kJ/mol.
S_29815_CO = 197.66

dH_CO = A*t + B*t**2/2 + C*t**3/3 + D*t**4/4 - E/t + F - H;
S_CO = (A*np.log(t) + B*t + C*t**2/2 + D*t**3/3 - E/(2*t**2) + G);

4 CO_{2}

\url{http://webbook.nist.gov/cgi/cbook.cgi?ID=C124389&Units=SI&Mask=1#Thermo-Gas}

# 298. - 1200.K valid temperature range
A =   24.99735
B =   55.18696
C =  -33.69137
D =   7.948387
E =  -0.136638
F =  -403.6075
G =   228.2431
H =  -393.5224

Hf_29815_CO2 = -393.51 # this is Hf.
S_29815_CO2 = 213.79

dH_CO2 = A*t + B*t**2/2 + C*t**3/3 + D*t**4/4 - E/t + F - H;
S_CO2 = (A*np.log(t) + B*t + C*t**2/2 + D*t**3/3 - E/(2*t**2) + G);

5 Standard state heat of reaction

We compute the enthalpy and free energy of reaction at 298.15 K for the following reaction \(CO + H2O \rightleftharpoons H2 + CO2\).

Hrxn_29815 = Hf_29815_CO2 + Hf_29815_H2 - Hf_29815_CO - Hf_29815_H2O;
Srxn_29815 = S_29815_CO2 + S_29815_H2 - S_29815_CO - S_29815_H2O;
Grxn_29815 = Hrxn_29815 - 298.15*(Srxn_29815)/1000;

print('deltaH = {0:1.2f}'.format(Hrxn_29815))
print('deltaG = {0:1.2f}'.format(Grxn_29815))
>>> >>> >>> deltaH = -41.15
deltaG = -28.62

6 Non-standard state \(\Delta H\) and \(\Delta G\)

We have to correct for temperature change away from standard state. We only correct the enthalpy for this temperature change. The correction looks like this:

$$ \Delta H_{rxn}(T) = \Delta H_{rxn}(T_{ref}) + \sum_i \nu_i (H_i(T)-H_i(T_{ref}))$$

Where \(\nu_i\) are the stoichiometric coefficients of each species, with appropriate sign for reactants and products, and \((H_i(T)-H_i(T_{ref})\) is precisely what is calculated for each species with the equations

The entropy is on an absolute scale, so we directly calculate entropy at each temperature. Recall that H is in kJ/mol and S is in J/mol/K, so we divide S by 1000 to make the units match.

Hrxn = Hrxn_29815 + dH_CO2 + dH_H2 - dH_CO - dH_H2O
Grxn = Hrxn - T*(S_CO2 + S_H2 - S_CO - S_H2O)/1000

7 Plot how the \(\Delta G\) varies with temperature

import matplotlib.pyplot as plt
plt.figure(); plt.clf()
plt.plot(T,Grxn, label='$\Delta G_{rxn}$')
plt.plot(T,Hrxn, label='$\Delta H_{rxn}$')
plt.xlabel('Temperature (K)')
plt.ylabel('(kJ/mol)')
plt.legend( loc='best')
plt.savefig('images/wgs-nist-1.png')
<matplotlib.figure.Figure object at 0x04199CF0>
[<matplotlib.lines.Line2D object at 0x0429BF30>]
[<matplotlib.lines.Line2D object at 0x0427DFB0>]
<matplotlib.text.Text object at 0x041B79F0>
<matplotlib.text.Text object at 0x040CEF70>
<matplotlib.legend.Legend object at 0x043CB5F0>

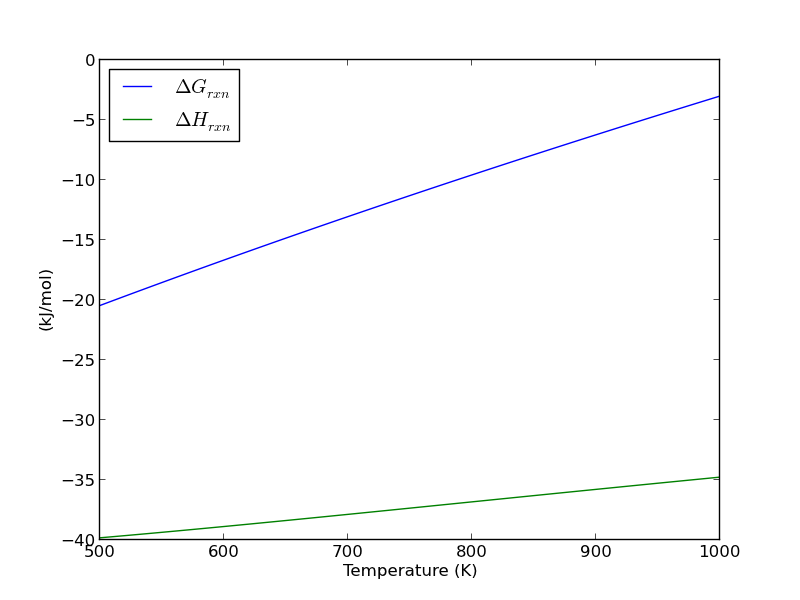
Over this temperature range the reaction is exothermic, although near 1000K it is just barely exothermic. At higher temperatures we expect the reaction to become endothermic.

8 Equilibrium constant calculation

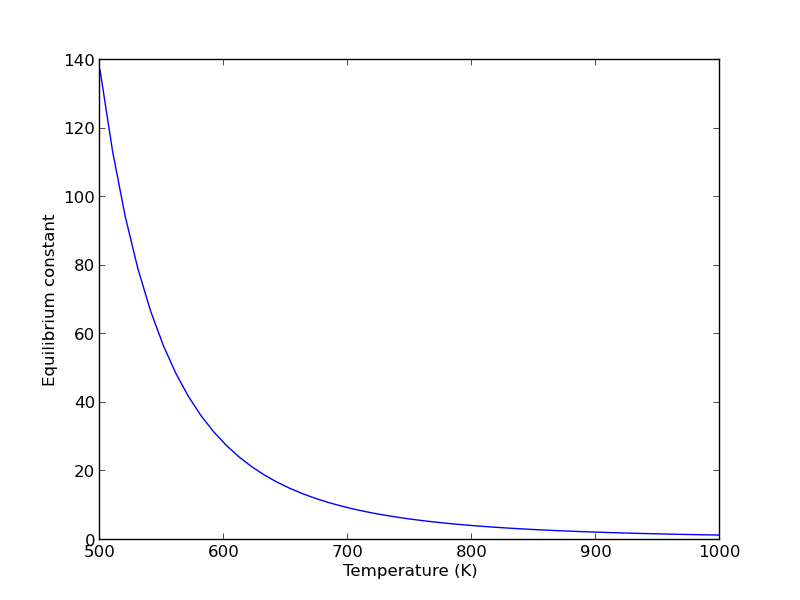
Note the equilibrium constant starts out high, i.e. strongly favoring the formation of products, but drops very quicky with increasing temperature.

R = 8.314e-3 # kJ/mol/K
K = np.exp(-Grxn/R/T);

plt.figure()
plt.plot(T,K)
plt.xlim([500, 1000])
plt.xlabel('Temperature (K)')
plt.ylabel('Equilibrium constant')
plt.savefig('images/wgs-nist-2.png')
>>> >>> <matplotlib.figure.Figure object at 0x044DBE90>
[<matplotlib.lines.Line2D object at 0x045A53F0>]
(500, 1000)
<matplotlib.text.Text object at 0x04577470>
<matplotlib.text.Text object at 0x0457F410>

9 Equilibrium yield of WGS

Now let us suppose we have a reactor with a feed of H_2O and CO at 10atm at 1000K. What is the equilibrium yield of H_2? Let \(\epsilon\) be the extent of reaction, so that \(F_i = F_{i,0} + \nu_i \epsilon\). For reactants, \(\nu_i\) is negative, and for products, \(\nu_i\) is positive. We have to solve for the extent of reaction that satisfies the equilibrium condition.

from scipy.interpolate import interp1d
from scipy.optimize import fsolve

# 
# A = CO
# B = H2O
# C = H2
# D = CO2

Pa0 = 5; Pb0 = 5; Pc0 = 0; Pd0 = 0;  # pressure in atm
R = 0.082;
Temperature = 1000;

# we can estimate the equilibrium like this. We could also calculate it
# using the equations above, but we would have to evaluate each term. Above
# we simply computed a vector of enthalpies, entropies, etc... Here we interpolate
K_func = interp1d(T,K);
K_Temperature = K_func(1000)


# If we let X be fractional conversion then we have $C_A = C_{A0}(1-X)$,
# $C_B = C_{B0}-C_{A0}X$, $C_C = C_{C0}+C_{A0}X$, and $C_D =
# C_{D0}+C_{A0}X$. We also have $K(T) = (C_C C_D)/(C_A C_B)$, which finally
# reduces to $0 = K(T) - Xeq^2/(1-Xeq)^2$ under these conditions.

def f(X):
    return K_Temperature - X**2/(1-X)**2;

x0 = 0.5
Xeq, = fsolve(f, x0)

print('The equilibrium conversion for these feed conditions is: {0:1.2f}'.format(Xeq))
>>> >>> ... ... ... ... ... >>> >>> >>> >>> >>> ... ... ... >>> >>> >>> >>> ... ... ... ... >>> ... ... >>> >>> >>> 0.54504291144
The equilibrium conversion for these feed conditions is: 0.55

10 Compute gas phase pressures of each species

Since there is no change in moles for this reaction, we can directly calculation the pressures from the equilibrium conversion and the initial pressure of gases. you can see there is a slightly higher pressure of H_2 and CO_2 than the reactants, consistent with the equilibrium constant of about 1.44 at 1000K. At a lower temperature there would be a much higher yield of the products. For example, at 550K the equilibrium constant is about 58, and the pressure of H_2 is 4.4 atm due to a much higher equilibrium conversion of 0.88.

P_CO = Pa0*(1-Xeq)
P_H2O = Pa0*(1-Xeq)
P_H2 = Pa0*Xeq
P_CO2 = Pa0*Xeq

print P_CO,P_H2O, P_H2, P_CO2
>>> >>> >>> >>> 2.2747854428 2.2747854428 2.7252145572 2.7252145572

11 Compare the equilibrium constants

We can compare the equilibrium constant from the Gibbs free energy and the one from the ratio of pressures. They should be the same!

print K_Temperature
print (P_CO2*P_H2)/(P_CO*P_H2O)
1.43522674762
1.43522674762

They are the same.

12 Summary

The NIST Webbook provides a plethora of data for computing thermodynamic properties. It is a little tedious to enter it all into Matlab, and a little tricky to use the data to estimate temperature dependent reaction energies. A limitation of the Webbook is that it does not tell you have the thermodynamic properties change with pressure. Luckily, those changes tend to be small.

I noticed a different behavior in interpolation between scipy.interpolate.interp1d and Matlab's interp1. The scipy function returns an interpolating function, whereas the Matlab function directly interpolates new values, and returns the actual interpolated data.

Copyright (C) 2013 by John Kitchin. See the License for information about copying.

org-mode source

Discuss on Twitter

Smooth transitions between discontinuous functions

| categories: nonlinear algebra, miscellaneous | tags:

original post

In Post 1280 we used a correlation for the Fanning friction factor for turbulent flow in a pipe. For laminar flow (Re < 3000), there is another correlation that is commonly used: \(f_F = 16/Re\). Unfortunately, the correlations for laminar flow and turbulent flow have different values at the transition that should occur at Re = 3000. This discontinuity can cause a lot of problems for numerical solvers that rely on derivatives.

Today we examine a strategy for smoothly joining these two functions. First we define the two functions.

import numpy as np
from scipy.optimize import fsolve
import matplotlib.pyplot as plt

def fF_laminar(Re):
    return 16.0 / Re

def fF_turbulent_unvectorized(Re):
    # Nikuradse correlation for turbulent flow
    # 1/np.sqrt(f) = (4.0*np.log10(Re*np.sqrt(f))-0.4)
    # we have to solve this equation to get f
    def func(f):
        return 1/np.sqrt(f) - (4.0*np.log10(Re*np.sqrt(f))-0.4)
    fguess = 0.01
    f, = fsolve(func, fguess)
    return f

# this enables us to pass vectors to the function and get vectors as
# solutions
fF_turbulent = np.vectorize(fF_turbulent_unvectorized)

Now we plot the correlations.

Re1 = np.linspace(500, 3000)
f1 = fF_laminar(Re1)

Re2 = np.linspace(3000, 10000)
f2 = fF_turbulent(Re2)

plt.figure(1); plt.clf()
plt.plot(Re1, f1, label='laminar')
plt.plot(Re2, f2, label='turbulent')
plt.xlabel('Re')
plt.ylabel('$f_F$')
plt.legend()
plt.savefig('images/smooth-transitions-1.png')
>>> >>> >>> >>> >>> <matplotlib.figure.Figure object at 0x051FF630>
[<matplotlib.lines.Line2D object at 0x05963C10>]
[<matplotlib.lines.Line2D object at 0x0576DD70>]
<matplotlib.text.Text object at 0x0577CFF0>
<matplotlib.text.Text object at 0x05798790>
<matplotlib.legend.Legend object at 0x05798030>

You can see the discontinuity at Re = 3000. What we need is a method to join these two functions smoothly. We can do that with a sigmoid function. Sigmoid functions

A sigmoid function smoothly varies from 0 to 1 according to the equation: \(\sigma(x) = \frac{1}{1 + e^{-(x-x0)/\alpha}}\). The transition is centered on \(x0\), and \(\alpha\) determines the width of the transition.

x = np.linspace(-4,4);
y = 1.0 / (1 + np.exp(-x / 0.1))
plt.figure(2); plt.clf()
plt.plot(x, y)
plt.xlabel('x'); plt.ylabel('y'); plt.title('$\sigma(x)$')
plt.savefig('images/smooth-transitions-sigma.png')
>>> <matplotlib.figure.Figure object at 0x0596CF10>
[<matplotlib.lines.Line2D object at 0x05A26D90>]
<matplotlib.text.Text object at 0x059A6050>
<matplotlib.text.Text object at 0x059AF0D0>
<matplotlib.text.Text object at 0x059BEA30>

If we have two functions, \(f_1(x)\) and \(f_2(x)\) we want to smoothly join, we do it like this: \(f(x) = (1-\sigma(x))f_1(x) + \sigma(x)f_2(x)\). There is no formal justification for this form of joining, it is simply a mathematical convenience to get a numerically smooth function. Other functions besides the sigmoid function could also be used, as long as they smoothly transition from 0 to 1, or from 1 to zero.

def fanning_friction_factor(Re):
    '''combined, continuous correlation for the fanning friction factor.
    the alpha parameter is chosen to provide the desired smoothness.
    The transition region is about +- 4*alpha. The value 450 was
    selected to reasonably match the shape of the correlation
    function provided by Morrison (see last section of this file)'''
    sigma =  1. / (1 + np.exp(-(Re - 3000.0) / 450.0));
    f = (1-sigma) * fF_laminar(Re) + sigma * fF_turbulent(Re)
    return f

Re = np.linspace(500,10000);
f = fanning_friction_factor(Re);

# add data to figure 1
plt.figure(1)
plt.plot(Re,f, label='smooth transition')
plt.xlabel('Re')
plt.ylabel('$f_F$')
plt.legend()
plt.savefig('images/smooth-transitions-3.png')
... ... ... ... ... ... ... ... >>> >>> >>> >>> ... <matplotlib.figure.Figure object at 0x051FF630>
[<matplotlib.lines.Line2D object at 0x05786310>]
<matplotlib.text.Text object at 0x0577CFF0>
<matplotlib.text.Text object at 0x05798790>
<matplotlib.legend.Legend object at 0x05A302B0>

You can see that away from the transition the combined function is practically equivalent to the original two functions. That is because away from the transition the sigmoid function is 0 or 1. Near Re = 3000 is a smooth transition from one curve to the other curve.

Morrison derived a single function for the friction factor correlation over all Re: \(f = \frac{0.0076\left(\frac{3170}{Re}\right)^{0.165}}{1 + \left(\frac{3171}{Re}\right)^{7.0}} + \frac{16}{Re}\). Here we show the comparison with the approach used above. The friction factor differs slightly at high Re, because Morrison's is based on the Prandlt correlation, while the work here is based on the Nikuradse correlation. They are similar, but not the same.

# add this correlation to figure 1
h, = plt.plot(Re, 16.0/Re + (0.0076 * (3170 / Re)**0.165) / (1 + (3170.0 / Re)**7))

ax = plt.gca()
handles, labels = ax.get_legend_handles_labels()

handles.append(h)
labels.append('Morrison')
ax.legend(handles, labels)
plt.savefig('images/smooth-transitions-morrison.png')
>>> >>> >>> >>> >>> >>> >>> <matplotlib.legend.Legend object at 0x05A5AEB0>

1 Summary

The approach demonstrated here allows one to smoothly join two discontinuous functions that describe physics in different regimes, and that must transition over some range of data. It should be emphasized that the method has no physical basis, it simply allows one to create a mathematically smooth function, which could be necessary for some optimizers or solvers to work.

Copyright (C) 2013 by John Kitchin. See the License for information about copying.

org-mode source

Discuss on Twitter

Linear programming example with inequality constraints

| categories: linear programming, optimization | tags:

Matlab post

adapted from http://www.matrixlab-examples.com/linear-programming.html which solves this problem with fminsearch.

Let us suppose that a merry farmer has 75 roods (4 roods = 1 acre) on which to plant two crops: wheat and corn. To produce these crops, it costs the farmer (for seed, water, fertilizer, etc. ) $120 per rood for the wheat, and $210 per rood for the corn. The farmer has $15,000 available for expenses, but after the harvest the farmer must store the crops while awaiting favorable or good market conditions. The farmer has storage space for 4,000 bushels. Each rood yields an average of 110 bushels of wheat or 30 bushels of corn. If the net profit per bushel of wheat (after all the expenses) is $1.30 and for corn is $2.00, how should the merry farmer plant the 75 roods to maximize profit?

Let \(x\) be the number of roods of wheat planted, and \(y\) be the number of roods of corn planted. The profit function is: \( P = (110)($1.3)x + (30)($2)y = 143x + 60y \)

There are some constraint inequalities, specified by the limits on expenses, storage and roodage. They are:

\(\$120x + \$210y <= \$15000\) (The total amount spent cannot exceed the amount the farm has)

\(110x + 30y <= 4000\) (The amount generated should not exceed storage space.)

\(x + y <= 75\) (We cannot plant more space than we have.)

\(0 <= x and 0 <= y \) (all amounts of planted land must be positive.)

To solve this problem, we cast it as a linear programming problem, which minimizes a function f(X) subject to some constraints. We create a proxy function for the negative of profit, which we seek to minimize.

f = -(143*x + 60*y)

from scipy.optimize import fmin_cobyla

def objective(X):
    '''objective function to minimize. It is the negative of profit,
    which we seek to maximize.'''
    x, y = X
    return -(143*x + 60*y)

def c1(X):
    'Ensure 120x + 210y <= 15000'
    x,y = X
    return 15000 - 120 * x - 210*y

def c2(X):
    'ensure 110x + 30y <= 4000'
    x,y = X
    return 4000 - 110*x - 30 * y

def c3(X):
    'Ensure x + y is less than or equal to 75'
    x,y = X
    return 75 - x - y

def c4(X):
    'Ensure x >= 0'
    return X[0]

def c5(X):
    'Ensure y >= 0'
    return X[1]

X = fmin_cobyla(objective, x0=[20, 30], cons=[c1, c2, c3, c4, c5])

print 'We should plant {0:1.2f} roods of wheat.'.format(X[0])
print 'We should plant {0:1.2f} roods of corn'.format(X[1])
print 'The maximum profit we can earn is ${0:1.2f}.'.format(-objective(X))
   Normal return from subroutine COBYLA

   NFVALS =   40   F =-6.315625E+03    MAXCV = 4.547474E-13
   X = 2.187500E+01   5.312500E+01
We should plant 21.88 roods of wheat.
We should plant 53.12 roods of corn
The maximum profit we can earn is $6315.62.

This code is not exactly the same as the original post, but we get to the same answer. The linear programming capability in scipy is currently somewhat limited in 0.10. It is a little better in 0.11, but probably not as advanced as Matlab. There are some external libraries available:

  1. http://abel.ee.ucla.edu/cvxopt/
  2. http://openopt.org/LP

Copyright (C) 2013 by John Kitchin. See the License for information about copying.

org-mode source

Discuss on Twitter

Curve fitting to get overlapping peak areas

| categories: data analysis | tags:

Today we examine an approach to fitting curves to overlapping peaks to deconvolute them so we can estimate the area under each curve. We have a text file that contains data from a gas chromatograph with two peaks that overlap. We want the area under each peak to estimate the gas composition. You will see how to read the text file in, parse it to get the data for plotting and analysis, and then how to fit it.

A line like “# of Points 9969” tells us the number of points we have to read. The data starts after a line containing “R.Time Intensity”. Here we read the number of points, and then get the data into arrays.

import numpy as np
import matplotlib.pyplot as plt

datafile = 'data/gc-data-21.txt'

i = 0
with open(datafile) as f:
    lines = f.readlines()

for i,line in enumerate(lines):
    if '# of Points' in line:
        npoints = int(line.split()[-1])
    elif 'R.Time        Intensity' in line:
        i += 1
        break

# now get the data
t, intensity = [], []
for j in range(i, i + npoints):
    fields = lines[j].split()
    t += [float(fields[0])]
    intensity += [int(fields[1])]

t = np.array(t)
intensity = np.array(intensity)

# now plot the data in the relevant time frame
plt.plot(t, intensity)
plt.xlim([4, 6])
plt.xlabel('Time (s)')
plt.ylabel('Intensity (arb. units)')
plt.savefig('images/deconvolute-1.png')
>>> >>> >>> >>> >>> ... ... >>> ... ... ... ... ... ... >>> ... >>> ... ... ... ... >>> >>> >>> >>> ... [<matplotlib.lines.Line2D object at 0x04CE6CF0>]
(4, 6)
<matplotlib.text.Text object at 0x04BBB950>
<matplotlib.text.Text object at 0x04BD0A10>

You can see there is a non-zero baseline. We will normalize that by the average between 4 and 4.4 seconds.

intensity -= np.mean(intensity[(t> 4) & (t < 4.4)])
plt.figure()
plt.plot(t, intensity)
plt.xlim([4, 6])
plt.xlabel('Time (s)')
plt.ylabel('Intensity (arb. units)')
plt.savefig('./images/deconvolute-2.png')
<matplotlib.figure.Figure object at 0x04CF7950>
[<matplotlib.lines.Line2D object at 0x04DF5C30>]
(4, 6)
<matplotlib.text.Text object at 0x04DDB690>
<matplotlib.text.Text object at 0x04DE3630>

The peaks are asymmetric, decaying gaussian functions. We define a function for this

from scipy.special import erf

def asym_peak(t, pars):
    'from Anal. Chem. 1994, 66, 1294-1301'
    a0 = pars[0]  # peak area
    a1 = pars[1]  # elution time
    a2 = pars[2]  # width of gaussian
    a3 = pars[3]  # exponential damping term
    f = (a0/2/a3*np.exp(a2**2/2.0/a3**2 + (a1 - t)/a3)
         *(erf((t-a1)/(np.sqrt(2.0)*a2) - a2/np.sqrt(2.0)/a3) + 1.0))
    return f

To get two peaks, we simply add two peaks together.

def two_peaks(t, *pars):    
    'function of two overlapping peaks'
    a10 = pars[0]  # peak area
    a11 = pars[1]  # elution time
    a12 = pars[2]  # width of gaussian
    a13 = pars[3]  # exponential damping term
    a20 = pars[4]  # peak area
    a21 = pars[5]  # elution time
    a22 = pars[6]  # width of gaussian
    a23 = pars[7]  # exponential damping term   
    p1 = asym_peak(t, [a10, a11, a12, a13])
    p2 = asym_peak(t, [a20, a21, a22, a23])
    return p1 + p2

To show the function is close to reasonable, we plot the fitting function with an initial guess for each parameter. The fit is not good, but we have only guessed the parameters for now.

parguess = (1500, 4.85, 0.05, 0.05, 5000, 5.1, 0.05, 0.1)
plt.figure()
plt.plot(t, intensity)
plt.plot(t,two_peaks(t, *parguess),'g-')
plt.xlim([4, 6])
plt.xlabel('Time (s)')
plt.ylabel('Intensity (arb. units)')
plt.savefig('images/deconvolution-3.png')
<matplotlib.figure.Figure object at 0x04FEF690>
[<matplotlib.lines.Line2D object at 0x05049870>]
[<matplotlib.lines.Line2D object at 0x04FEFA90>]
(4, 6)
<matplotlib.text.Text object at 0x0502E210>
<matplotlib.text.Text object at 0x050362B0>

Next, we use nonlinear curve fitting from scipy.optimize.curve_fit

from scipy.optimize import curve_fit

popt, pcov = curve_fit(two_peaks, t, intensity, parguess)
print popt

plt.plot(t, two_peaks(t, *popt), 'r-')
plt.legend(['data', 'initial guess','final fit'])

plt.savefig('images/deconvolution-4.png')
>>> >>> [  1.31039283e+03   4.87474330e+00   5.55414785e-02   2.50610175e-02
   5.32556821e+03   5.14121507e+00   4.68236129e-02   1.04105615e-01]
>>> [<matplotlib.lines.Line2D object at 0x0505BA10>]
<matplotlib.legend.Legend object at 0x05286270>

The fits are not perfect. The small peak is pretty good, but there is an unphysical tail on the larger peak, and a small mismatch at the peak. There is not much to do about that, it means the model peak we are using is not a good model for the peak. We will still integrate the areas though.

pars1 = popt[0:4]
pars2 = popt[4:8]

peak1 = asym_peak(t, pars1)
peak2 = asym_peak(t, pars2)

area1 = np.trapz(peak1, t)
area2 = np.trapz(peak2, t)

print 'Area 1 = {0:1.2f}'.format(area1)
print 'Area 2 = {0:1.2f}'.format(area2)

print 'Area 1 is {0:1.2%} of the whole area'.format(area1/(area1 + area2))
print 'Area 2 is {0:1.2%} of the whole area'.format(area2/(area1 + area2))

plt.figure()
plt.plot(t, intensity)
plt.plot(t, peak1, 'r-')
plt.plot(t, peak2, 'g-')
plt.xlim([4, 6])
plt.xlabel('Time (s)')
plt.ylabel('Intensity (arb. units)')
plt.legend(['data', 'peak 1', 'peak 2'])
plt.savefig('images/deconvolution-5.png')
>>> >>> >>> >>> >>> >>> >>> >>> Area 1 = 1310.39
Area 2 = 5325.57
>>> Area 1 is 19.75% of the whole area
Area 2 is 80.25% of the whole area
>>> <matplotlib.figure.Figure object at 0x05286ED0>
[<matplotlib.lines.Line2D object at 0x053A5AB0>]
[<matplotlib.lines.Line2D object at 0x05291D30>]
[<matplotlib.lines.Line2D object at 0x053B9810>]
(4, 6)
<matplotlib.text.Text object at 0x0529C4B0>
<matplotlib.text.Text object at 0x052A3450>
<matplotlib.legend.Legend object at 0x053B9ED0>

This sample was air, and the first peak is oxygen, and the second peak is nitrogen. we come pretty close to the actual composition of air, although it is low on the oxygen content. To do better, one would have to use a calibration curve.

In the end, the overlap of the peaks is pretty small, but it is still difficult to reliably and reproducibly deconvolute them. By using an algorithm like we have demonstrated here, it is possible at least to make the deconvolution reproducible.

1 Notable differences from Matlab

  1. The order of arguments to np.trapz is reversed.
  2. The order of arguments to the fitting function scipy.optimize.curve_fit is different than in Matlab.
  3. The scipy.optimize.curve_fit function expects a fitting function that has all parameters as arguments, where Matlab expects a vector of parameters.

Copyright (C) 2013 by John Kitchin. See the License for information about copying.

org-mode source

Discuss on Twitter

Mimicking ode events in python

| categories: ode | tags:

The ODE functions in scipy.integrate do not directly support events like the functions in Matlab do. We can achieve something like it though, by digging into the guts of the solver, and writing a little code. In previous example I used an event to count the number of roots in a function by integrating the derivative of the function.

import numpy as np
from scipy.integrate import odeint

def myode(f, x):
    return 3*x**2 + 12*x -4

def event(f, x):
    'an event is when f = 0'
    return f 

# initial conditions
x0 = -8
f0 = -120

# final x-range and step to integrate over.
xf = 4   #final x value
deltax = 0.45 #xstep

# lists to store the results in
X = [x0]
sol = [f0]
e = [event(f0, x0)]
events = []
x2 = x0
# manually integrate at each time step, and check for event sign changes at each step
while x2 <= xf: #stop integrating when we get to xf
    x1 = X[-1]
    x2 = x1 + deltax
    f1 = sol[-1]
    
    f2 = odeint(myode, f1, [x1, x2]) # integrate from x1,f1 to x2,f2
    X += [x2]
    sol += [f2[-1][0]]

    # now evaluate the event at the last position
    e += [event(sol[-1], X[-1])]

    if e[-1] * e[-2] < 0:
        # Event detected where the sign of the event has changed. The
        # event is between xPt = X[-2] and xLt = X[-1]. run a modified bisect
        # function to narrow down to find where event = 0
        xLt = X[-1]
        fLt = sol[-1]
        eLt = e[-1]

        xPt = X[-2]
        fPt = sol[-2]
        ePt = e[-2]

        j = 0
        while j < 100:
            if np.abs(xLt - xPt) < 1e-6:
                # we know the interval to a prescribed precision now.
                # print 'Event found between {0} and {1}'.format(x1t, x2t)
                print 'x = {0}, event = {1}, f = {2}'.format(xLt, eLt, fLt)
                events += [(xLt, fLt)]
                break # and return to integrating

            m = (ePt - eLt)/(xPt - xLt) #slope of line connecting points
                                        #bracketing zero

            #estimated x where the zero is      
            new_x = -ePt / m + xPt

            # now get the new value of the integrated solution at that new x
            f  = odeint(myode, fPt, [xPt, new_x])
            new_f = f[-1][-1]
            new_e = event(new_f, new_x)
                        
            # now check event sign change
            if eLt * new_e > 0:
                xPt = new_x
                fPt = new_f
                ePt = new_e
            else:
                xLt = new_x
                fLt = new_f
                eLt = new_e

            j += 1
        
        
import matplotlib.pyplot as plt
plt.plot(X, sol)

# add event points to the graph
for x,e in events:
    plt.plot(x,e,'bo ')
plt.savefig('images/event-ode-1.png')
x = -6.00000006443, event = -4.63518112781e-15, f = -4.63518112781e-15
x = -1.99999996234, event = -1.40512601554e-15, f = -1.40512601554e-15
x = 1.99999988695, event = -1.11022302463e-15, f = -1.11022302463e-15

That was a lot of programming to do something like find the roots of the function! Below is an example of using a function coded into pycse to solve the same problem. It is a bit more sophisticated because you can define whether an event is terminal, and the direction of the approach to zero for each event.

from pycse import *
import numpy as np

def myode(f, x):
    return 3*x**2 + 12*x -4

def event1(f, x):
    'an event is when f = 0 and event is decreasing'
    isterminal = True
    direction = -1
    return f, isterminal, direction

def event2(f, x):
    'an event is when f = 0 and increasing'
    isterminal = False
    direction = 1
    return f, isterminal, direction

f0 = -120

xspan = np.linspace(-8, 4)
X, F, TE, YE, IE = odelay(myode, f0, xspan, events=[event1, event2])

import matplotlib.pyplot as plt
plt.plot(X, F, '.-')

# plot the event locations.use a different color for each event
colors = 'rg'

for x,y,i in zip(TE, YE, IE):
    plt.plot([x], [y], 'o', color=colors[i])
    
plt.savefig('images/event-ode-2.png')
plt.show()
print TE, YE, IE
[-6.0000001083101306, -1.9999999635550625] [-3.0871138978483259e-14, -7.7715611723760958e-16] [1, 0]

Copyright (C) 2013 by John Kitchin. See the License for information about copying.

org-mode source

Discuss on Twitter
« Previous Page -- Next Page »