Computing a pipe diameter

| categories: nonlinear algebra | tags: fluids

Matlab post A heat exchanger must handle 2.5 L/s of water through a smooth pipe with length of 100 m. The pressure drop cannot exceed 103 kPa at 25 degC. Compute the minimum pipe diameter required for this application.

Adapted from problem 8.8 in Problem solving in chemical and Biochemical Engineering with Polymath, Excel, and Matlab. page 303.

We need to estimate the Fanning friction factor for these conditions so we can estimate the frictional losses that result in a pressure drop for a uniform, circular pipe. The frictional forces are given by \(F_f = 2f_F \frac{\Delta L v^2}{D}\), and the corresponding pressure drop is given by \(\Delta P = \rho F_f\). In these equations, \(\rho\) is the fluid density, \(v\) is the fluid velocity, \(D\) is the pipe diameter, and \(f_F\) is the Fanning friction factor. The average fluid velocity is given by \(v = \frac{q}{\pi D^2/4}\).

For laminar flow, we estimate \(f_F = 16/Re\), which is a linear equation, and for turbulent flow (\(Re > 2100\)) we have the implicit equation \(\frac{1}{\sqrt{f_F}}=4.0 \log(Re \sqrt{f_F})-0.4\). Of course, we define \(Re = \frac{D v\rho}{\mu}\) where \(\mu\) is the viscosity of the fluid.

It is known that \(\rho(T) = 46.048 + 9.418 T -0.0329 T^2 +4.882\times10^{-5}-2.895\times10^{-8}T^4\) and \(\mu = \exp\left({-10.547 + \frac{541.69}{T-144.53}}\right)\) where \(\rho\) is in kg/m^3 and \(\mu\) is in kg/(m*s).

The aim is to find \(D\) that solves: \(\Delta p = \rho 2 f_F \frac{\Delta L v^2}{D}\). This is a nonlinear equation in \(D\), since D affects the fluid velocity, the Re, and the Fanning friction factor. Here is the solution

import numpy as np
from scipy.optimize import fsolve
import matplotlib.pyplot as plt

T = 25 + 273.15
Q = 2.5e-3       # m^3/s
deltaP = 103000  # Pa
deltaL = 100     # m

#Note these correlations expect dimensionless T, where the magnitude
# of T is in K

def rho(T):
    return 46.048 + 9.418 * T -0.0329 * T**2 +4.882e-5 * T**3 - 2.895e-8 * T**4

def mu(T):
    return np.exp(-10.547 + 541.69 / (T - 144.53))

def fanning_friction_factor_(Re):
    if Re < 2100:
        raise Exception('Flow is probably not turbulent, so this correlation is not appropriate.')
    # solve the Nikuradse correlation to get the friction factor
    def fz(f): return 1.0/np.sqrt(f) - (4.0*np.log10(Re*np.sqrt(f))-0.4)
    sol, = fsolve(fz, 0.01)
    return sol

fanning_friction_factor = np.vectorize(fanning_friction_factor_)

Re = np.linspace(2200, 9000)
f = fanning_friction_factor(Re)

plt.plot(Re, f)
plt.xlabel('Re')
plt.ylabel('fanning friction factor')
# You can see why we use 0.01 as an initial guess for solving for the
# Fanning friction factor; it falls in the middle of ranges possible
# for these Re numbers.
plt.savefig('images/pipe-diameter-1.png')

def objective(D):
    v = Q / (np.pi * D**2 / 4)
    Re = D * v * rho(T) / mu(T)

    fF = fanning_friction_factor(Re)

    return deltaP - 2 * fF * rho(T) * deltaL * v**2 / D
    
D, = fsolve(objective, 0.04)

print('The minimum pipe diameter is {0} m\n'.format(D))
The minimum pipe diameter is 0.0389653369531 m

Any pipe diameter smaller than that value will result in a larger pressure drop at the same volumetric flow rate, or a smaller volumetric flowrate at the same pressure drop. Either way, it will not meet the design specification.

Copyright (C) 2013 by John Kitchin. See the License for information about copying.
org-mode source

Discuss on Twitter

Water gas shift equilibria via the NIST Webbook

| categories: nonlinear algebra | tags:

Matlab post

The NIST webbook provides parameterized models of the enthalpy, entropy and heat capacity of many molecules. In this example, we will examine how to use these to compute the equilibrium constant for the water gas shift reaction \(CO + H_2O \rightleftharpoons CO_2 + H_2\) in the temperature range of 500K to 1000K.

Parameters are provided for:

Cp = heat capacity (J/mol*K) H = standard enthalpy (kJ/mol) S = standard entropy (J/mol*K)

with models in the form: \(Cp^\circ = A + B*t + C*t^2 + D*t^3 + E/t^2\)

\(H^\circ - H^\circ_{298.15}= A*t + B*t^2/2 + C*t^3/3 + D*t^4/4 - E/t + F - H\)

\(S^\circ = A*ln(t) + B*t + C*t^2/2 + D*t^3/3 - E/(2*t^2) + G\)

where \(t=T/1000\), and \(T\) is the temperature in Kelvin. We can use this data to calculate equilibrium constants in the following manner. First, we have heats of formation at standard state for each compound; for elements, these are zero by definition, and for non-elements, they have values available from the NIST webbook. There are also values for the absolute entropy at standard state. Then, we have an expression for the change in enthalpy from standard state as defined above, as well as the absolute entropy. From these we can derive the reaction enthalpy, free energy and entropy at standard state, as well as at other temperatures.

We will examine the water gas shift enthalpy, free energy and equilibrium constant from 500K to 1000K, and finally compute the equilibrium composition of a gas feed containing 5 atm of CO and H_2 at 1000K.

import numpy as np

T = np.linspace(500,1000) # degrees K
t = T/1000;

1 hydrogen

\url{http://webbook.nist.gov/cgi/cbook.cgi?ID=C1333740&Units=SI&Mask=1#Thermo-Gas}

# T = 298-1000K valid temperature range
A =  33.066178
B = -11.363417
C =  11.432816
D = -2.772874
E = -0.158558
F = -9.980797
G =  172.707974
H =  0.0

Hf_29815_H2 = 0.0 # kJ/mol
S_29815_H2 = 130.68 # J/mol/K

dH_H2 = A*t + B*t**2/2 + C*t**3/3 + D*t**4/4 - E/t + F - H;
S_H2 = (A*np.log(t) + B*t + C*t**2/2 + D*t**3/3 - E/(2*t**2) + G);

2 H_{2}O

\url{http://webbook.nist.gov/cgi/cbook.cgi?ID=C7732185&Units=SI&Mask=1#Thermo-Gas}

Note these parameters limit the temperature range we can examine, as these parameters are not valid below 500K. There is another set of parameters for lower temperatures, but we do not consider them here.

# 500-1700 K valid temperature range
A =   30.09200
B =   6.832514
C =   6.793435
D =  -2.534480
E =   0.082139
F =  -250.8810
G =   223.3967
H =  -241.8264

Hf_29815_H2O = -241.83 #this is Hf.
S_29815_H2O = 188.84

dH_H2O = A*t + B*t**2/2 + C*t**3/3 + D*t**4/4 - E/t + F - H;
S_H2O = (A*np.log(t) + B*t + C*t**2/2 + D*t**3/3 - E/(2*t**2) + G);

3 CO

\url{http://webbook.nist.gov/cgi/cbook.cgi?ID=C630080&Units=SI&Mask=1#Thermo-Gas}

# 298. - 1300K valid temperature range
A =   25.56759
B =   6.096130
C =   4.054656
D =  -2.671301
E =   0.131021
F =  -118.0089
G =   227.3665
H = -110.5271

Hf_29815_CO = -110.53 #this is Hf kJ/mol.
S_29815_CO = 197.66

dH_CO = A*t + B*t**2/2 + C*t**3/3 + D*t**4/4 - E/t + F - H;
S_CO = (A*np.log(t) + B*t + C*t**2/2 + D*t**3/3 - E/(2*t**2) + G);

4 CO_{2}

\url{http://webbook.nist.gov/cgi/cbook.cgi?ID=C124389&Units=SI&Mask=1#Thermo-Gas}

# 298. - 1200.K valid temperature range
A =   24.99735
B =   55.18696
C =  -33.69137
D =   7.948387
E =  -0.136638
F =  -403.6075
G =   228.2431
H =  -393.5224

Hf_29815_CO2 = -393.51 # this is Hf.
S_29815_CO2 = 213.79

dH_CO2 = A*t + B*t**2/2 + C*t**3/3 + D*t**4/4 - E/t + F - H;
S_CO2 = (A*np.log(t) + B*t + C*t**2/2 + D*t**3/3 - E/(2*t**2) + G);

5 Standard state heat of reaction

We compute the enthalpy and free energy of reaction at 298.15 K for the following reaction \(CO + H2O \rightleftharpoons H2 + CO2\).

Hrxn_29815 = Hf_29815_CO2 + Hf_29815_H2 - Hf_29815_CO - Hf_29815_H2O;
Srxn_29815 = S_29815_CO2 + S_29815_H2 - S_29815_CO - S_29815_H2O;
Grxn_29815 = Hrxn_29815 - 298.15*(Srxn_29815)/1000;

print('deltaH = {0:1.2f}'.format(Hrxn_29815))
print('deltaG = {0:1.2f}'.format(Grxn_29815))
>>> >>> >>> deltaH = -41.15
deltaG = -28.62

6 Non-standard state \(\Delta H\) and \(\Delta G\)

We have to correct for temperature change away from standard state. We only correct the enthalpy for this temperature change. The correction looks like this:

$$ \Delta H_{rxn}(T) = \Delta H_{rxn}(T_{ref}) + \sum_i \nu_i (H_i(T)-H_i(T_{ref}))$$

Where \(\nu_i\) are the stoichiometric coefficients of each species, with appropriate sign for reactants and products, and \((H_i(T)-H_i(T_{ref})\) is precisely what is calculated for each species with the equations

The entropy is on an absolute scale, so we directly calculate entropy at each temperature. Recall that H is in kJ/mol and S is in J/mol/K, so we divide S by 1000 to make the units match.

Hrxn = Hrxn_29815 + dH_CO2 + dH_H2 - dH_CO - dH_H2O
Grxn = Hrxn - T*(S_CO2 + S_H2 - S_CO - S_H2O)/1000

7 Plot how the \(\Delta G\) varies with temperature

import matplotlib.pyplot as plt
plt.figure(); plt.clf()
plt.plot(T,Grxn, label='$\Delta G_{rxn}$')
plt.plot(T,Hrxn, label='$\Delta H_{rxn}$')
plt.xlabel('Temperature (K)')
plt.ylabel('(kJ/mol)')
plt.legend( loc='best')
plt.savefig('images/wgs-nist-1.png')
<matplotlib.figure.Figure object at 0x04199CF0>
[<matplotlib.lines.Line2D object at 0x0429BF30>]
[<matplotlib.lines.Line2D object at 0x0427DFB0>]
<matplotlib.text.Text object at 0x041B79F0>
<matplotlib.text.Text object at 0x040CEF70>
<matplotlib.legend.Legend object at 0x043CB5F0>

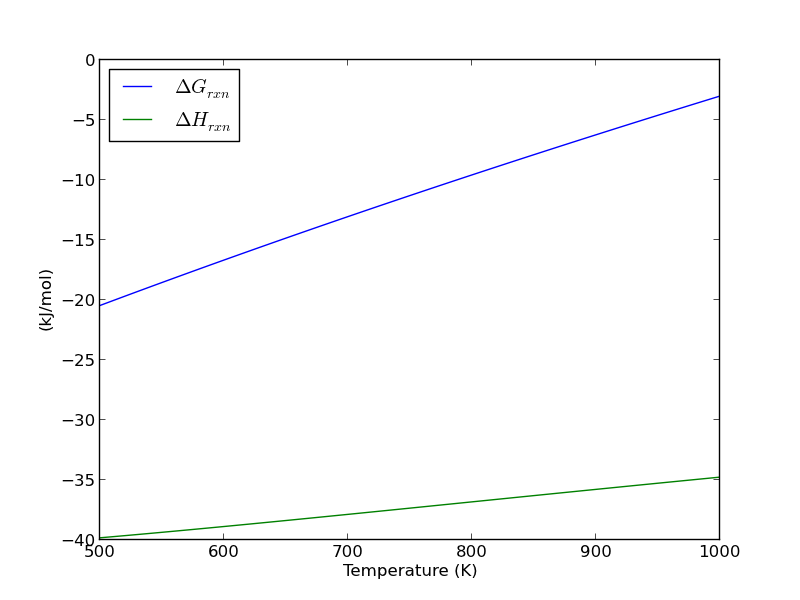
Over this temperature range the reaction is exothermic, although near 1000K it is just barely exothermic. At higher temperatures we expect the reaction to become endothermic.

8 Equilibrium constant calculation

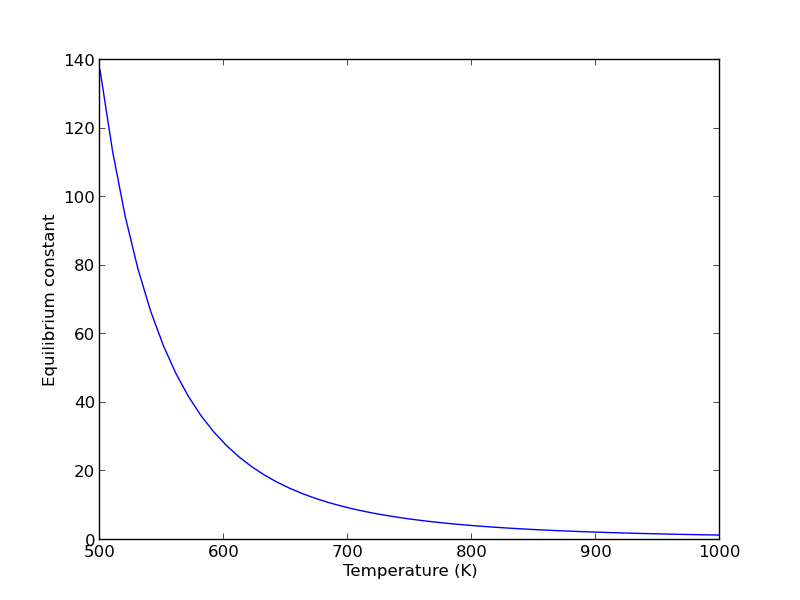
Note the equilibrium constant starts out high, i.e. strongly favoring the formation of products, but drops very quicky with increasing temperature.

R = 8.314e-3 # kJ/mol/K
K = np.exp(-Grxn/R/T);

plt.figure()
plt.plot(T,K)
plt.xlim([500, 1000])
plt.xlabel('Temperature (K)')
plt.ylabel('Equilibrium constant')
plt.savefig('images/wgs-nist-2.png')
>>> >>> <matplotlib.figure.Figure object at 0x044DBE90>
[<matplotlib.lines.Line2D object at 0x045A53F0>]
(500, 1000)
<matplotlib.text.Text object at 0x04577470>
<matplotlib.text.Text object at 0x0457F410>

9 Equilibrium yield of WGS

Now let us suppose we have a reactor with a feed of H_2O and CO at 10atm at 1000K. What is the equilibrium yield of H_2? Let \(\epsilon\) be the extent of reaction, so that \(F_i = F_{i,0} + \nu_i \epsilon\). For reactants, \(\nu_i\) is negative, and for products, \(\nu_i\) is positive. We have to solve for the extent of reaction that satisfies the equilibrium condition.

from scipy.interpolate import interp1d
from scipy.optimize import fsolve

# 
# A = CO
# B = H2O
# C = H2
# D = CO2

Pa0 = 5; Pb0 = 5; Pc0 = 0; Pd0 = 0;  # pressure in atm
R = 0.082;
Temperature = 1000;

# we can estimate the equilibrium like this. We could also calculate it
# using the equations above, but we would have to evaluate each term. Above
# we simply computed a vector of enthalpies, entropies, etc... Here we interpolate
K_func = interp1d(T,K);
K_Temperature = K_func(1000)


# If we let X be fractional conversion then we have $C_A = C_{A0}(1-X)$,
# $C_B = C_{B0}-C_{A0}X$, $C_C = C_{C0}+C_{A0}X$, and $C_D =
# C_{D0}+C_{A0}X$. We also have $K(T) = (C_C C_D)/(C_A C_B)$, which finally
# reduces to $0 = K(T) - Xeq^2/(1-Xeq)^2$ under these conditions.

def f(X):
    return K_Temperature - X**2/(1-X)**2;

x0 = 0.5
Xeq, = fsolve(f, x0)

print('The equilibrium conversion for these feed conditions is: {0:1.2f}'.format(Xeq))
>>> >>> ... ... ... ... ... >>> >>> >>> >>> >>> ... ... ... >>> >>> >>> >>> ... ... ... ... >>> ... ... >>> >>> >>> 0.54504291144
The equilibrium conversion for these feed conditions is: 0.55

10 Compute gas phase pressures of each species

Since there is no change in moles for this reaction, we can directly calculation the pressures from the equilibrium conversion and the initial pressure of gases. you can see there is a slightly higher pressure of H_2 and CO_2 than the reactants, consistent with the equilibrium constant of about 1.44 at 1000K. At a lower temperature there would be a much higher yield of the products. For example, at 550K the equilibrium constant is about 58, and the pressure of H_2 is 4.4 atm due to a much higher equilibrium conversion of 0.88.

P_CO = Pa0*(1-Xeq)
P_H2O = Pa0*(1-Xeq)
P_H2 = Pa0*Xeq
P_CO2 = Pa0*Xeq

print P_CO,P_H2O, P_H2, P_CO2
>>> >>> >>> >>> 2.2747854428 2.2747854428 2.7252145572 2.7252145572

11 Compare the equilibrium constants

We can compare the equilibrium constant from the Gibbs free energy and the one from the ratio of pressures. They should be the same!

print K_Temperature
print (P_CO2*P_H2)/(P_CO*P_H2O)
1.43522674762
1.43522674762

They are the same.

12 Summary

The NIST Webbook provides a plethora of data for computing thermodynamic properties. It is a little tedious to enter it all into Matlab, and a little tricky to use the data to estimate temperature dependent reaction energies. A limitation of the Webbook is that it does not tell you have the thermodynamic properties change with pressure. Luckily, those changes tend to be small.

I noticed a different behavior in interpolation between scipy.interpolate.interp1d and Matlab's interp1. The scipy function returns an interpolating function, whereas the Matlab function directly interpolates new values, and returns the actual interpolated data.

Copyright (C) 2013 by John Kitchin. See the License for information about copying.
org-mode source

Discuss on Twitter

Smooth transitions between discontinuous functions

| categories: nonlinear algebra, miscellaneous | tags:

original post

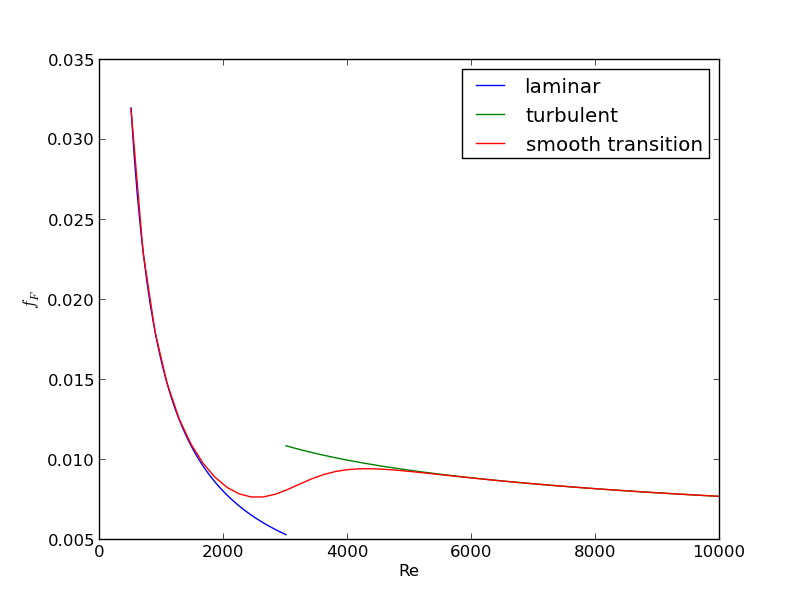
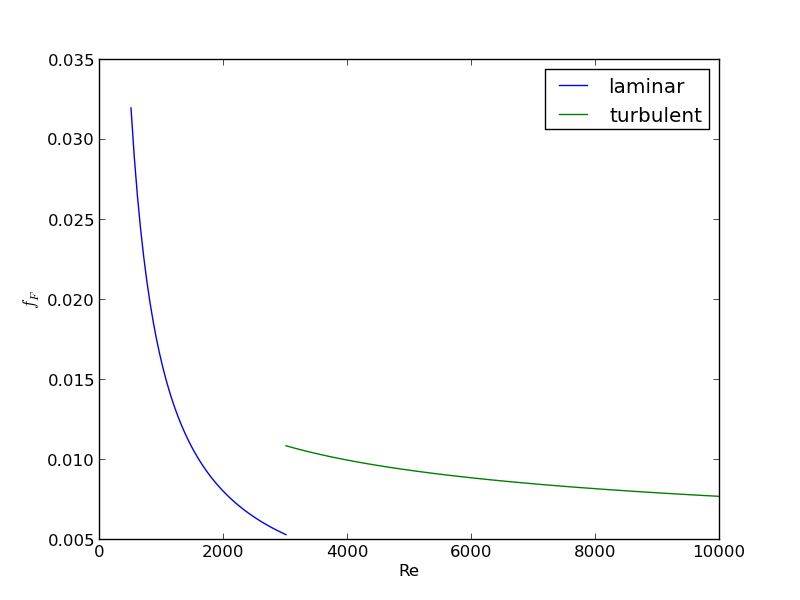
In Post 1280 we used a correlation for the Fanning friction factor for turbulent flow in a pipe. For laminar flow (Re < 3000), there is another correlation that is commonly used: \(f_F = 16/Re\). Unfortunately, the correlations for laminar flow and turbulent flow have different values at the transition that should occur at Re = 3000. This discontinuity can cause a lot of problems for numerical solvers that rely on derivatives.

Today we examine a strategy for smoothly joining these two functions. First we define the two functions.

import numpy as np
from scipy.optimize import fsolve
import matplotlib.pyplot as plt

def fF_laminar(Re):
    return 16.0 / Re

def fF_turbulent_unvectorized(Re):
    # Nikuradse correlation for turbulent flow
    # 1/np.sqrt(f) = (4.0*np.log10(Re*np.sqrt(f))-0.4)
    # we have to solve this equation to get f
    def func(f):
        return 1/np.sqrt(f) - (4.0*np.log10(Re*np.sqrt(f))-0.4)
    fguess = 0.01
    f, = fsolve(func, fguess)
    return f

# this enables us to pass vectors to the function and get vectors as
# solutions
fF_turbulent = np.vectorize(fF_turbulent_unvectorized)

Now we plot the correlations.

Re1 = np.linspace(500, 3000)
f1 = fF_laminar(Re1)

Re2 = np.linspace(3000, 10000)
f2 = fF_turbulent(Re2)

plt.figure(1); plt.clf()
plt.plot(Re1, f1, label='laminar')
plt.plot(Re2, f2, label='turbulent')
plt.xlabel('Re')
plt.ylabel('$f_F$')
plt.legend()
plt.savefig('images/smooth-transitions-1.png')
>>> >>> >>> >>> >>> <matplotlib.figure.Figure object at 0x051FF630>
[<matplotlib.lines.Line2D object at 0x05963C10>]
[<matplotlib.lines.Line2D object at 0x0576DD70>]
<matplotlib.text.Text object at 0x0577CFF0>
<matplotlib.text.Text object at 0x05798790>
<matplotlib.legend.Legend object at 0x05798030>

You can see the discontinuity at Re = 3000. What we need is a method to join these two functions smoothly. We can do that with a sigmoid function. Sigmoid functions

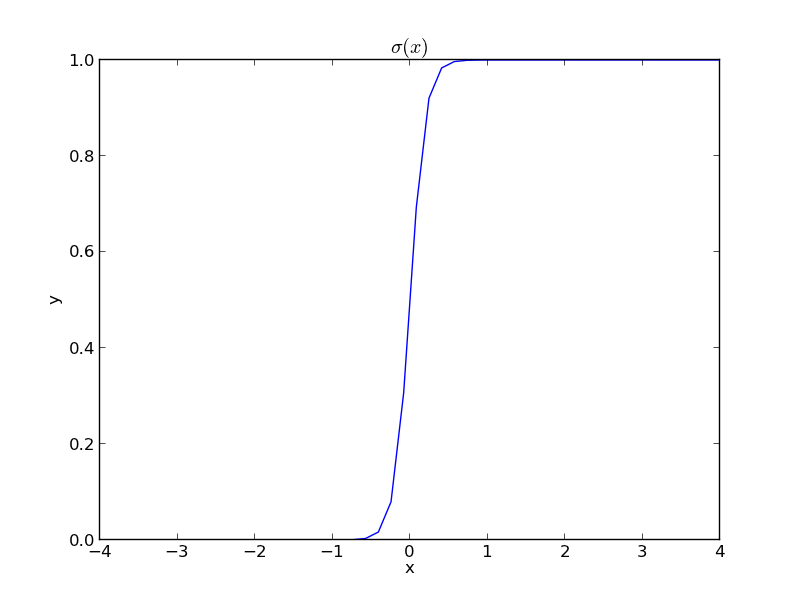
A sigmoid function smoothly varies from 0 to 1 according to the equation: \(\sigma(x) = \frac{1}{1 + e^{-(x-x0)/\alpha}}\). The transition is centered on \(x0\), and \(\alpha\) determines the width of the transition.

x = np.linspace(-4,4);
y = 1.0 / (1 + np.exp(-x / 0.1))
plt.figure(2); plt.clf()
plt.plot(x, y)
plt.xlabel('x'); plt.ylabel('y'); plt.title('$\sigma(x)$')
plt.savefig('images/smooth-transitions-sigma.png')
>>> <matplotlib.figure.Figure object at 0x0596CF10>
[<matplotlib.lines.Line2D object at 0x05A26D90>]
<matplotlib.text.Text object at 0x059A6050>
<matplotlib.text.Text object at 0x059AF0D0>
<matplotlib.text.Text object at 0x059BEA30>

If we have two functions, \(f_1(x)\) and \(f_2(x)\) we want to smoothly join, we do it like this: \(f(x) = (1-\sigma(x))f_1(x) + \sigma(x)f_2(x)\). There is no formal justification for this form of joining, it is simply a mathematical convenience to get a numerically smooth function. Other functions besides the sigmoid function could also be used, as long as they smoothly transition from 0 to 1, or from 1 to zero.

def fanning_friction_factor(Re):
    '''combined, continuous correlation for the fanning friction factor.
    the alpha parameter is chosen to provide the desired smoothness.
    The transition region is about +- 4*alpha. The value 450 was
    selected to reasonably match the shape of the correlation
    function provided by Morrison (see last section of this file)'''
    sigma =  1. / (1 + np.exp(-(Re - 3000.0) / 450.0));
    f = (1-sigma) * fF_laminar(Re) + sigma * fF_turbulent(Re)
    return f

Re = np.linspace(500,10000);
f = fanning_friction_factor(Re);

# add data to figure 1
plt.figure(1)
plt.plot(Re,f, label='smooth transition')
plt.xlabel('Re')
plt.ylabel('$f_F$')
plt.legend()
plt.savefig('images/smooth-transitions-3.png')
... ... ... ... ... ... ... ... >>> >>> >>> >>> ... <matplotlib.figure.Figure object at 0x051FF630>
[<matplotlib.lines.Line2D object at 0x05786310>]
<matplotlib.text.Text object at 0x0577CFF0>
<matplotlib.text.Text object at 0x05798790>
<matplotlib.legend.Legend object at 0x05A302B0>

You can see that away from the transition the combined function is practically equivalent to the original two functions. That is because away from the transition the sigmoid function is 0 or 1. Near Re = 3000 is a smooth transition from one curve to the other curve.

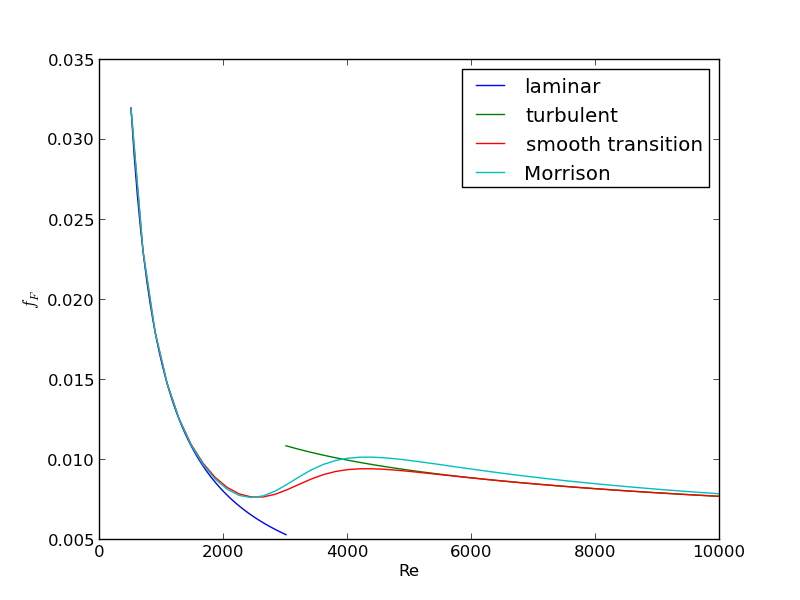
Morrison derived a single function for the friction factor correlation over all Re: \(f = \frac{0.0076\left(\frac{3170}{Re}\right)^{0.165}}{1 + \left(\frac{3171}{Re}\right)^{7.0}} + \frac{16}{Re}\). Here we show the comparison with the approach used above. The friction factor differs slightly at high Re, because Morrison's is based on the Prandlt correlation, while the work here is based on the Nikuradse correlation. They are similar, but not the same.

# add this correlation to figure 1
h, = plt.plot(Re, 16.0/Re + (0.0076 * (3170 / Re)**0.165) / (1 + (3170.0 / Re)**7))

ax = plt.gca()
handles, labels = ax.get_legend_handles_labels()

handles.append(h)
labels.append('Morrison')
ax.legend(handles, labels)
plt.savefig('images/smooth-transitions-morrison.png')
>>> >>> >>> >>> >>> >>> >>> <matplotlib.legend.Legend object at 0x05A5AEB0>

1 Summary

The approach demonstrated here allows one to smoothly join two discontinuous functions that describe physics in different regimes, and that must transition over some range of data. It should be emphasized that the method has no physical basis, it simply allows one to create a mathematically smooth function, which could be necessary for some optimizers or solvers to work.

Copyright (C) 2013 by John Kitchin. See the License for information about copying.
org-mode source

Discuss on Twitter

Solving integral equations with fsolve

| categories: nonlinear algebra | tags: reaction engineering

Original post in Matlab

Occasionally we have integral equations we need to solve in engineering problems, for example, the volume of plug flow reactor can be defined by this equation: \(V = \int_{Fa(V=0)}^{Fa} \frac{1}{r_a} dFa\) where \(r_a\) is the rate law. Suppose we know the reactor volume is 100 L, the inlet molar flow of A is 1 mol/L, the volumetric flow is 10 L/min, and \(r_a = -k Ca\), with \(k=0.23\) 1/min. What is the exit molar flow rate? We need to solve the following equation:

$$100 = \int_{Fa(V=0)}^{Fa} \frac{1}{-k Fa/\nu} dFa$$

We start by creating a function handle that describes the integrand. We can use this function in the quad command to evaluate the integral.

import numpy as np
from scipy.integrate import quad
from scipy.optimize import fsolve

k = 0.23
nu = 10.0
Fao = 1.0

def integrand(Fa):
    return -1.0 / (k * Fa / nu)

def func(Fa):
    integral,err = quad(integrand, Fao, Fa)
    return 100.0 - integral

vfunc = np.vectorize(func)

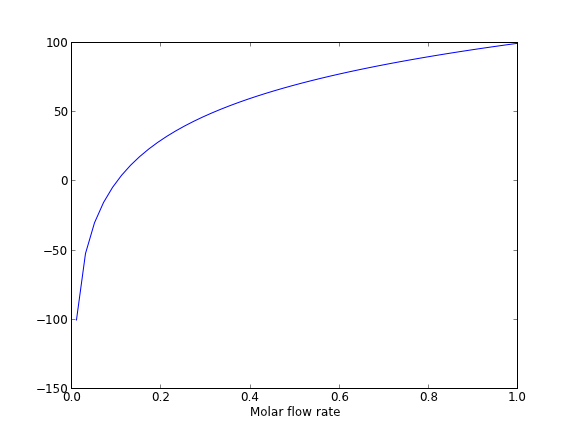
We will need an initial guess, so we make a plot of our function to get an idea.

import matplotlib.pyplot as plt

f = np.linspace(0.01, 1)
plt.plot(f, vfunc(f))
plt.xlabel('Molar flow rate')
plt.savefig('images/integral-eqn-guess.png')
plt.show()
>>> >>> [<matplotlib.lines.Line2D object at 0x964a910>]
<matplotlib.text.Text object at 0x961fe50>

Now we can see a zero is near Fa = 0.1, so we proceed to solve the equation.

Fa_guess = 0.1
Fa_exit, = fsolve(vfunc, Fa_guess)
print 'The exit concentration is {0:1.2f} mol/L'.format(Fa_exit / nu)
>>> The exit concentration is 0.01 mol/L

1 Summary notes

This example seemed a little easier in Matlab, where the quad function seemed to get automatically vectorized. Here we had to do it by hand.

Copyright (C) 2013 by John Kitchin. See the License for information about copying.
org-mode source

Discuss on Twitter
« Previous Page