2018 in a nutshell for the Kitchin Research Group
Posted December 31, 2018 at 03:17 PM | categories: news | tags:
Updated December 31, 2018 at 03:22 PM
Table of Contents
The majority of this year was spent finishing my sabbatical in the Google Accelerated Science Research group. I finished that up in August, and have returned to Pittsburgh now. I spent that time learning about differentiable programming and machine learning applications in science and engineering. It was a great learning year for me, and the beginning of some new research directions.
It wasn't all work, I was able to bike over 3000 miles while we lived in California, spent lots of weekends at beaches, state parks, San Francisco, and many other beautiful places. There is a lot I miss from my sabbatical, but I am mostly glad to be back home.
1 An all new research group
In 2017, the last of my students finished, and my group shrunk temporarily to zero for a semester. That luckily coincided with the beginning of my sabbatical, which allowed me to focus exclusively on starting new research directions. Towards the end of last year, three new PhD students joined my group. I did not take any new PhD students this year, but several new MS students joined the group at the end of 2018:
- Siddhant Lambor (co-advised with Prof. Lynn Walker)
- Gautham Swaminathan (co-advised with Prof. Lynn Walker)
- Siddarth Achar
- Senhong Liu
- Dingqi Nai
- Qiong Wang
These students will all work on some aspect of machine learning in formulation research, design of experiments, and molecular simulation. It should be an exciting year!
2 Publications
2018 was a light year on publications, largely due to my group shrinking to zero, and being on sabbatical. I wrote a nice perspective article on machine learning in catalysis:
- kitchin-2018-machin-learn-catal
- This perspective article describes how machine learning is being used in catalysis research and opportunities for further research.
And several publications from past M.S. students got finished and published:
- thirumalai-2018-inves-react
- This paper shows that many single atom alloys have unique electronic structure features that are responsible for their special catalytic properties.
- gao-2018-model-pallad
- We used DFT calculations to build a neural network potential to model adatom diffusion on a metal surface.
- wang-2018-densit-funct
- We used DFT calculations to build a neural network potential to model zirconia polymorphs, oxygen vacancy formation and diffusion.
This was technically published in 2017, but it was the most cited article in J. Phys.: Cond. Matt. in 2018!
- larsen-2017-atomic-simul
- This is a modern update on the Atomic Simulation Environment Python software. We have been using and contributing to this software for about 15 years now!
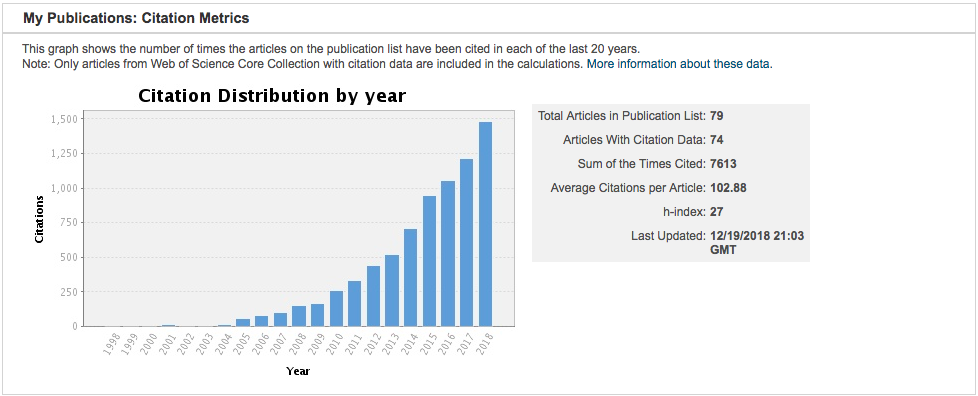
Citations on our past work continue to grow.
Bibliography
- [kitchin-2018-machin-learn-catal] John Kitchin, Machine Learning in Catalysis, Nature Catalysis, 1(4), 230-232 (2018). link. doi.
- [thirumalai-2018-inves-react] Hari Thirumalai & John Kitchin, Investigating the Reactivity of Single Atom Alloys Using Density Functional Theory, Topics in Catalysis, 61(5-6), 462-474 (2018). link. doi.
- [gao-2018-model-pallad] Tianyu Gao & John Kitchin, Modeling Palladium Surfaces With Density Functional Theory, Neural Networks and Molecular Dynamics, Catalysis Today, 312, 132-140 (2018). link. doi.
- [wang-2018-densit-funct] Chen Wang, Akshay Tharval & John Kitchin, A Density Functional Theory Parameterised Neural Network Model of Zirconia, Molecular Simulation, 44(8), 623-630 (2018). link. doi.
- [larsen-2017-atomic-simul] Ask Hjorth Larsen, Jens J\orgen Mortensen, Jakob, Blomqvist, Ivano E Castelli, Rune Christensen, , Marcin Dułak, Jesper Friis, Michael N Groves, , Bj\ork Hammer, Cory Hargus, Eric D Hermes, Paul C, Jennings, Peter Bjerre Jensen, James Kermode, John, R Kitchin, Esben Leonhard Kolsbjerg, Joseph Kubal, , Kristen Kaasbjerg, Steen Lysgaard, J\'on Bergmann, Maronsson, Tristan Maxson, Thomas Olsen, Lars, Pastewka, Andrew Peterson, Carsten Rostgaard, Jakob, Schi\otz, Ole Sch\"utt, Mikkel Strange, Kristian, S Thygesen, Tejs Vegge, Lasse Vilhelmsen, Michael, Walter, Zhenhua Zeng & Karsten W Jacobsen, The Atomic Simulation Environment-A Python Library for Working With Atoms, Journal of Physics: Condensed Matter, 29(27), 273002 (2017). link.
3 New courses
On my return from my sabbatical, I taught a new course for me, 06-623 Mathematical modeling of chemical engineering processes. I taught this course in Python, and it was a tour of mathematical and scientific programming that started with "Hello world" 'Hello world' and ended with machine learning. We traveled through differential equations, nonlinear algebra, optimization, and regression along the way using numpy and scipy. It was a fun class, and I look forward to teaching it again next Fall. You can see the course notes at https://github.com/jkitchin/f18-06623. I ran this course using Jupyter notebooks (of course I wrote the notes in org-mode and used the jupyter notebook exporter I wrote to make these!) and Box.com. It worked, but wasn't my favorite. I will try to go back to Emacs+org-mode for this next year.
This coming spring will be another new course: our junior Transport Lab course.
4 Emacs, org-mode and scimax
org-ref has been downloaded close to 40K times! I thought it passed 40K early in December, but MELPA shows it with just under 40K today. They switched servers recently, so maybe some statistics were lost. If you count the Melpa-stable downloads, it is still over 40K. There are now over 50 contributors to org-ref besides me! That is pretty awesome, and hopefully speaks to the number of people interested in using Emacs for scientific publishing.
This fall I picked up scimax development again after my sabbatical break, and have a few notable improvements I will launch in 2019. These include:
- Many improvements to ipython in scimax:
- Code completion
- Inspection
- More jupyter-like features (?, ??) and key-bindings
- export to Jupyter notebooks
- src-block keymaps
- and more.
- A new editmarks package that will allow persistent comments, highlights, and track-change mode.
- Improved support for literate programming in org-mode including jump to the definition in org-mode.
Scimax is an increasingly important project to me, and in 2019 I am going to work on some ways that will make it easier for me to spend more time on it in the future.
5 Online activity
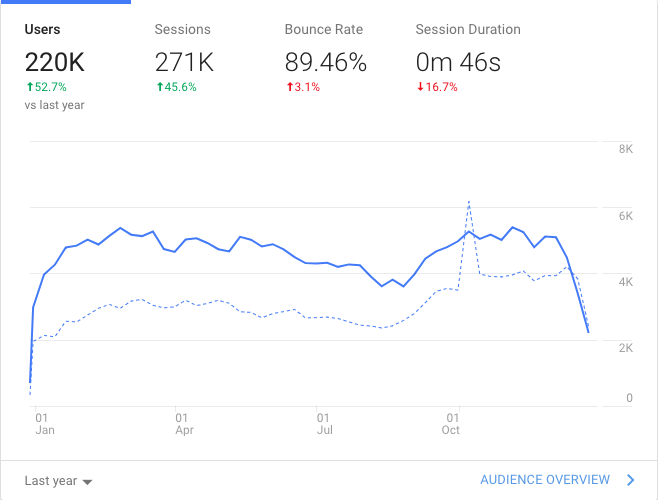
5.1 kitchingroup.cheme.cmu.edu
Since I was on sabbatical, it was a low volume blogging year with only 22 posts. Traffic to the blog was up nonetheless from the last year. I suspect I will blog more this year.
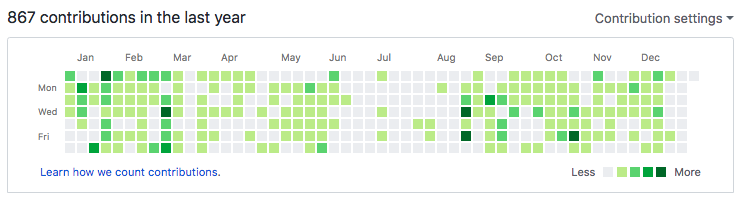
5.2 Github
I was even less active in 2018 than in 2017 on GitHub activity. You can see it picked back up this past fall as I returned to my day job as a professor. I expect 2019 will pick back up as usual.
5.3 YouTube
Our YouTube traffic is down this year compared to last year. It is still always interesting to see the spikes in traffic on the org-mode is awesome video. Maybe it got mentioned on Hacker News or something. I only made one video last year; I took a break while on sabbatical, and was busy this fall with a new course. Maybe 2019 will be a better year for that. I have some plans for new videos in the new year on ipython, and some updates in scimax.
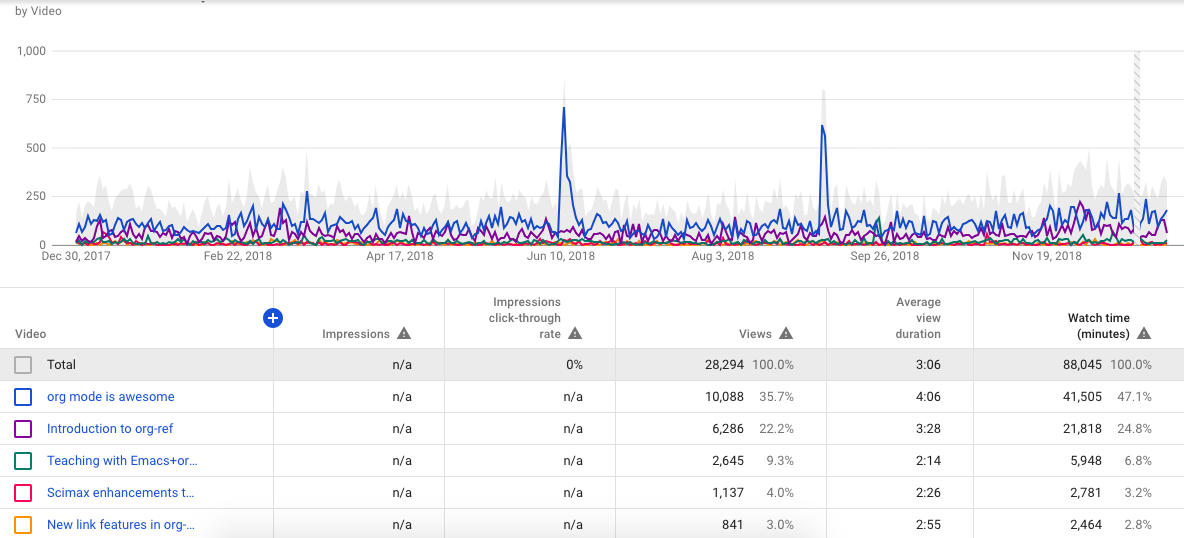
We did cross 1000 subscribers this year. That doesn't qualify my channel for monetization yet, you also need 4000 watch hours in the past year. Last year we only had 1466 hours, so not that close yet. Why am I interested in this? I am actively looking for ways to support scimax development, and this could be one way to do that.
5.4 Twitter
It wasn't super easy to get all the Twitter data, I had to manually download the information from each month. Now that I have it, I did some analysis, so here it is. First we look at how many tweets, likes, retweets, etc. there were last year:
import csv
import glob

tweets = 0
impressions = 0
texts = []
times = [] # times of the tweets
likes = 0
retweets = 0
replies = 0

for csvfile in glob.glob('*.csv'):
    with open(csvfile) as f:
        reader = csv.DictReader(f)
        for row in reader:
            tweets += 1
            impressions += float(row['impressions'])
            texts += [row['Tweet text']]
            times += [row['time']]
            likes += float(row['likes'])
            replies += float(row['replies'])
            retweets += float(row['retweets'])

print(f'''{tweets} Tweets with {int(impressions)} impressions.
There were {int(likes)} likes, {int(retweets)} retweets, and {int(replies)} replies.''')
471 Tweets with 282655 impressions. There were 1089 likes, 220 retweets, and 341 replies.
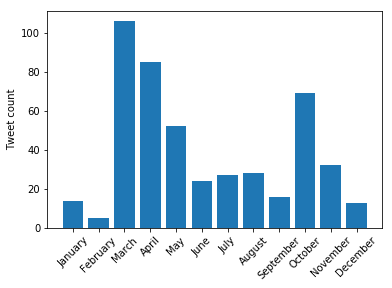
Next, we look at the time distribution of these tweets. It seems like this should be easier to do (it probably is in Pandas).
import datetime
import numpy as np

x = np.array([datetime.datetime.strptime(time[0:-6], "%Y-%m-%d %H:%M")
              for time in times])

months = np.zeros(12)
for time in x:
    months[time.month - 1] += 1

plt.bar(np.arange(12), months)
plt.xticks(np.arange(12), ['January', 'February', 'March',
                           'April', 'May', 'June',
                           'July', 'August', 'September',
                           'October', 'November', 'December'],
           rotation=45);
plt.ylabel('Tweet count')
6 Summary and outlook
2018 was a pretty good year. I took a break from several things I have spent a lot of time in the past and learned some new things I spend my time on now. I am looking forward to getting back to some of the old things, especially scimax development. I still think it is a key component of modern scientific research and publishing, and that it has an important role in education. Stay tuned!
Copyright (C) 2018 by John Kitchin. See the License for information about copying.
Org-mode version = 9.1.14