A new and improved Emacs gnuplot DSL
Posted May 05, 2017 at 10:26 AM | categories: lisp, emacs, plotting | tags:
Updated February 04, 2018 at 05:07 PM
A significant limitation of the previous DSL I wrote is that all the plotting commands have to go in one macro. It would be nice to accumulate them in different forms, and when you want to run them all. A classic way to do that in Emacs lisp is to make a global variable, e.g. *gnuplot-cmds* and append commands to it. Then when you want to, run the commands.
A more modern approach is to use a closure to encapsulate the commands. Here is a "let over lambda" that defines a few functions that encapsulate an enclosed variable gnuplot-commands. We define one function to add commands to the list of commands, one to clear the commands, one to generate the gnuplot script as a string, and one to run the program. The enclosed variable gnuplot-commands is basically only accessible by these functions. It is encapsulated, similar to if we defined a class in Python then made an instance of it with an attribute that was accessible only be instance methods. On one hand, this "protects" the variable, and keeps it out of the global namespace. On the other hand, we lose the documentation that would have come with a defvar, and we have to define a function to access the contents of that variable.
(let ((gnuplot-commands '("set terminal qt")))

  (defun gnuplot-add-cmd (s)
    "Append the command S to gnuplot-cmds."
    (setq gnuplot-commands (append gnuplot-commands (list s))))

  (defun gnuplot-clear ()
    (setq gnuplot-commands '("set terminal qt")))

  (defun gnuplot-script ()
    (s-join "\n" gnuplot-commands)))
gnuplot-script
To run the commands, we define this function. It does not need to be in the closure because it only accesses the commands through functions we defined in the closure.
(defun gnuplot-show ()
    (let* ((temporary-file-directory ".")
           (cmdfile (make-temp-file "gnuplot-cmds-" nil ".gpl"))
           (shellcmd (format "gnuplot --persist -c \"%s\"" cmdfile))
           (cmds (gnuplot-script)))
      (with-temp-file cmdfile
        (insert cmds))
      (shell-command shellcmd)
      (delete-file cmdfile)
      cmds))
gnuplot-show
Last time I noted I had a new idea for the DSL syntax that would give us more flexibility to inject variables and code into the DSL. The idea is to use keywords, symbols that start with :, to indicate they should be replaced by the value of the non-keyword symbol in the environment, and for any form that starts with : to evaluate that form. So, (: - 5 4) would get replaced by 1. Here is the new macro for that.
(defmacro kargs (&rest args)
  "Convert symbols to strings, quote strings, and (expr) to what they evaluate to."
  `(s-join " " (list ,@(cl-mapcan
                        (lambda (s)
                          (list
                           (cond
                            ((keywordp s)
                             (format "%s"
                                     (symbol-value (intern (substring (symbol-name s) 1)))))
                            ((symbolp s)
                             (symbol-name s))
                            ((stringp s)
                             (format "\"%s\"" s))
                            ((and (listp s) (eq : (car s)))
                             `(with-output-to-string
                                (princ ,(cdr s))))
                            (t
                             (format "%s" s)))))
                        args))))
kargs
Now, our gnuplot macro is simpler, since all it does is add commands to the list. If the form is a string, we add it as is, if the form starts with (: stuff) we evaluate the cdr of the form, and otherwise, we pass the form contents to the kargs macro for processing.
(defmacro gnuplot (&rest forms)
  `(loop for s in (list ,@(mapcar (lambda (x)
                                    (cond
                                     ((stringp x)
                                      x)
                                     ((and (listp x) (eq : (car x)))
                                      `,(cdr x))
                                     (t
                                      `(kargs ,@x))))
                                  forms))
         do (gnuplot-add-cmd s)))
gnuplot
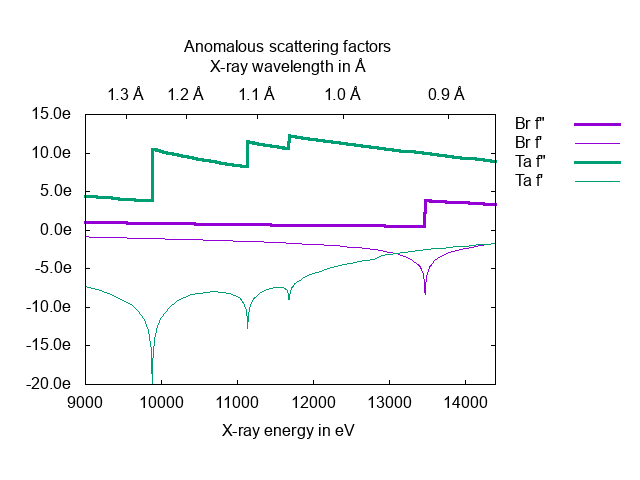
What did that gain us? First, we can break up a script so we can talk about it, maybe do some calculations, etc… Let's look at the example at http://gnuplot.sourceforge.net/demo/linkedaxes.html.
We can start with the basic settings.
(gnuplot-clear)

(gnuplot
 (set terminal png)
 (set output "linkedaxes.png")
 (set encoding utf8)
 (set key outside Left)
 (set bmargin 5)
 (set tmargin 6)
 (set style data lines)
 (set tics in)
 (set ticslevel 0.5)
 (set xlabel  "X-ray energy in eV")

 (set format y  \'%5.1fe\')
 (set title " Anomalous scattering factors ")
 (set xrange  [9000:14400])
 (set offset 0\,0\,1.0\,0)
 (set xtics nomirror)
 (set link x via 12398./x inverse 12398./x)

 (set x2label  "X-ray wavelength in Å")
 (set x2tics 0.1  format "%.1f Å" nomirror))
We need to download some data files. We can do that, and add another line to the gnuplot script. The escaping on the quotes and commas is especially tedious in this one ;) but, we don't need those pesky line-continuations here.
(shell-command "wget http://skuld.bmsc.washington.edu/scatter/data/Br.dat")
(shell-command "wget http://skuld.bmsc.washington.edu/scatter/data/Ta.dat")


(gnuplot
 (plot "Br.dat" volatile using 1:3 title \'Br f\"\'  lt 1 lw 3\, \'\' volatile using 1:2 title "Br f'"  lt 1 lw 1\,
       "Ta.dat" volatile using 1:3 title \'Ta f\"\' lt 2 lw 3\, \'\' volatile using 1:2 title \"Ta f\'\"  lt 2 lw 1))

(gnuplot-script)
set terminal qt
set terminal png
set output "linkedaxes.png"
set encoding utf8
set key outside Left
set bmargin 5
set tmargin 6
set style data lines
set tics in
set ticslevel 0.5
set xlabel "X-ray energy in eV"
set format y '%5.1fe'
set title " Anomalous scattering factors "
set xrange [9000:14400]
set offset 0,0,1.0,0
set xtics nomirror
set link x via 12398./x inverse 12398./x
set x2label "X-ray wavelength in Å"
set x2tics 0.1 format "%.1f Å" nomirror
plot "Br.dat" volatile using 1:3 title 'Br f"' lt 1 lw 3, '' volatile using 1:2 title "Br f'" lt 1 lw 1, "Ta.dat" volatile using 1:3 title 'Ta f"' lt 2 lw 3, '' volatile using 1:2 title "Ta f'" lt 2 lw 1
Finally, we can set the output to png, and run our program.
(gnuplot-show)
Looks good.
What about the fancy keyword formatting? Here is an example of that in action. :term gets replaced by the term variable, :png gets replaced by the filename, and :x is replaced by 4.
(gnuplot-clear)
(let ((x 4)
      (term "png")
      (png "\"polar.png\""))
  (gnuplot
   (set terminal :term)
   (set output :png)
   (set polar)
   (set dummy t)
   (plot sin\( :x *t\) \,cos\( :x *t\))
   (set offset 0\,0\,0\,0)))

(gnuplot-show)
set terminal qt
set terminal png
set output "polar.png"
set polar
set dummy t
plot sin( 4 *t) ,cos( 4 *t)
set offset 0,0,0,0
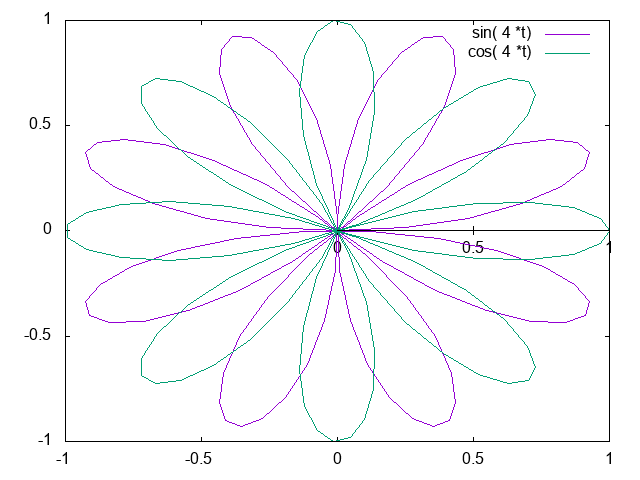
There are a few nuances I didn't expect. First, you have to escape the parentheses in this case because otherwise it looks like a form that will be ignored. Second, you have to quote the string to get quotes into the gnuplot script. Third, there has to be a space before and after the keywords for emacs to parse it correctly and do the substitution.
Let's look at one last example that uses the (: form). We reproduce a figure from http://gnuplot.sourceforge.net/demo/transparent_solids.html here.
(gnuplot-clear)
(gnuplot
 (set terminal pngcairo  background "#ffffff" enhanced font "arial,9" fontscale 1.0 size 512\, 384 )
 (set output "transparent-solids.png")
 ;; construct the title
 (set title (: format "\"%s\"" (concat "Interlocking Tori - PM3D surface" "with depth sorting and transparency")))

 ;; use lisp code to create a gnuplot command
 (: concat "unset" " " "border")

 (unset key)
 (set object 1 rect from screen 0\, 0\, 0 to screen 1\, 1\, 0 behind)
 (set object 1 rect fc  rgb \"gray\"  fillstyle solid 1.0  border -1)
 (set view 64\, 345\, 1.24375\, 0.995902)
 (set isosamples 50\, 20)
 (unset xtics)
 (unset ytics)
 (unset ztics)
 (set dummy u\,v)
 (set parametric)
 (set urange [ -pi : pi ])
 (set vrange [ -pi : pi ])

 (set style fill  transparent solid 0.30 border)
 (set pm3d depthorder)
 (set palette rgbformulae 8\, 9\, 7)
 (set pm3d interpolate 1\,1 flush begin noftriangles border lt black linewidth 0.500 dashtype solid corners2color mean)
 (set colorbox vertical origin screen 0.9\, 0.2\, 0 size screen 0.05\, 0.6\, 0 front  noinvert bdefault)

 (splot (: concat "cos(u)+.5*cos(u)*cos(v),sin(u)+.5*sin(u)*cos(v),.5*sin(v) with pm3d,"
           "1+cos(u)+.5*cos(u)*cos(v),.5*sin(v),sin(u)+.5*sin(u)*cos(v) with pm3d")))
(gnuplot-show)
set terminal qt
set terminal pngcairo background "#ffffff" enhanced font "arial,9" fontscale 1.0 size 512, 384
set output "transparent-solids.png"
set title "Interlocking Tori - PM3D surfacewith depth sorting and transparency"
unset border
unset key
set object 1 rect from screen 0, 0, 0 to screen 1, 1, 0 behind
set object 1 rect fc rgb "gray" fillstyle solid 1.0 border -1
set view 64, 345, 1.24375, 0.995902
set isosamples 50, 20
unset xtics
unset ytics
unset ztics
set dummy u,v
set parametric
set urange [-pi : pi]
set vrange [-pi : pi]
set style fill transparent solid 0.3 border
set pm3d depthorder
set palette rgbformulae 8, 9, 7
set pm3d interpolate 1,1 flush begin noftriangles border lt black linewidth 0.5 dashtype solid corners2color mean
set colorbox vertical origin screen 0.9, 0.2, 0 size screen 0.05, 0.6, 0 front noinvert bdefault
splot cos(u)+.5*cos(u)*cos(v),sin(u)+.5*sin(u)*cos(v),.5*sin(v) with pm3d,1+cos(u)+.5*cos(u)*cos(v),.5*sin(v),sin(u)+.5*sin(u)*cos(v) with pm3d
![]()
Overall this seems like an improvement to the DSL. I didn't invent the idea of reusing keywords this way out of the blue. In On Lisp, Paul graham uses "special" variable names in Chapter 18, where he shows how to use gensyms for special purposes, and also variables with special names like ?x. Even Emacs is using a variation of this idea. Check out this new let-alist macro:
(let-alist '((x . 5))
  (+ 1 .x))
6
There is a special variable inside the body that is a dot-name. The macro expands to provide a value for that symbol. I wonder if I should have tried to use an approach like this instead. Maybe another day. After I read and study the four defuns and single defmacro that make this possible!
You can see here what happens:
(macroexpand '(let-alist '((x . 5))
  (+ 1 .x)))
(let
    ((alist
      '((x . 5))))
  (let ((\.x (cdr (assq 'x alist))))
    (+ 1 \.x)))
The macro builds up an internal alist for the dot-names.
Copyright (C) 2018 by John Kitchin. See the License for information about copying.
Org-mode version = 9.1.6