Expanding orgmode.py to get better org-python integration
Posted May 29, 2016 at 02:03 PM | categories: orgmode, python | tags:
Updated May 29, 2016 at 03:51 PM
Table of Contents
I have only ever been about 80% satisfied with Python/org-mode integration. I have developed a particular workflow that I like a lot, and works well for solving scientific and engineering problems. I typically use stand-alone Python blocks, i.e. not sessions. I tend to use print statements to create output that I want to see, e.g. the value of a calculation. I also tend to create multiple figures in a single block, which I want to display in the buffer. This workflow is represented extensively in PYCSE and dft-book which collectively have 700+ src blocks! So I use it alot ;)
There are some deficiencies though. For one, I have had to hand build any figures/tables that are generated from the code blocks. That means duplicating filenames, adding the captions, etc… It is not that easy to update captions from the code blocks, and there has been limited ability to use markup in the output.
Well finally I had some ideas to change this. The ideas are:
- Patch matplotlib so that savefig actually returns a figure link that can be printed to the output. savefig works the same otherwise.
- Patch matplotlib.pyplot.show to save the figure, and print a figure link in thhe output.
- Create special functions to generate org tables and figures.
- Create some other functions to generate some blocks and elements.
Then we could just import the library in our Python scripts (or add it as a prologue) and get this nice functionality. You can find the code for this here:
https://github.com/jkitchin/pycse/blob/master/pycse/orgmode.py
Finally, it seems like a good idea to specify that we want our results to be an org drawer. This makes the figures/tables export, and allows us to generate math and other markup in our programs. That has the downside of making exported results not be in the "verbatim" markup I am used to, but that may be solvable in other ways. We can make the org drawer output the default like this:
(setq org-babel-default-header-args:python
      (cons '(:results . "output org drawer replace")
            (assq-delete-all :results org-babel-default-header-args)))
With these, using Python blocks in org-mode gets quite a bit better!
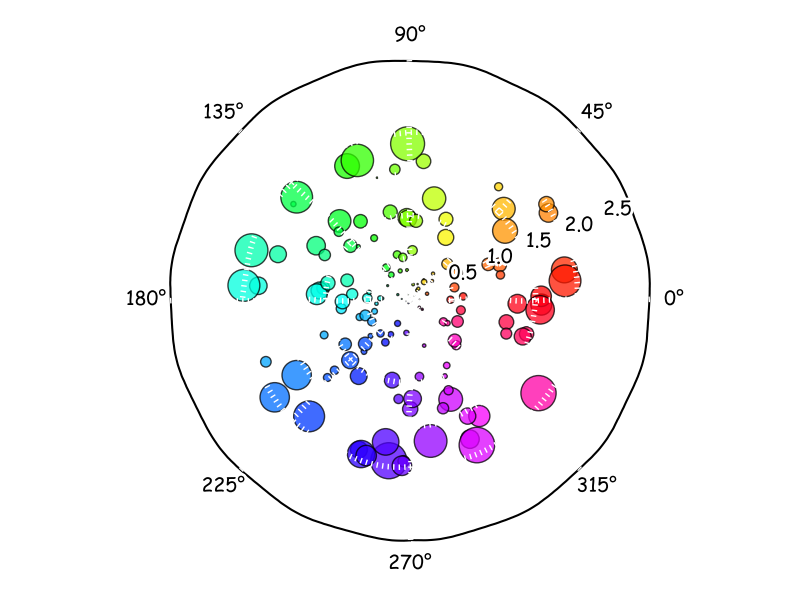
Here is the first example, with savefig. I have the savefig function return the link, so we have to print it. We use this feature later. The figure is automatically inserted to the buffer. Like magic!
Here is a fun figure from http://matplotlib.org/xkcd/examples/pie_and_polar_charts/polar_scatter_demo.html
import pycse.orgmode

import numpy as np
import matplotlib.pyplot as plt
plt.xkcd()

N = 150
r = 2 * np.random.rand(N)
theta = 2 * np.pi * np.random.rand(N)
area = 200 * r**2 * np.random.rand(N)
colors = theta

ax = plt.subplot(111, polar=True)
c = plt.scatter(theta, r, c=colors, s=area, cmap=plt.cm.hsv)
c.set_alpha(0.75)

print(plt.savefig('test.png'))
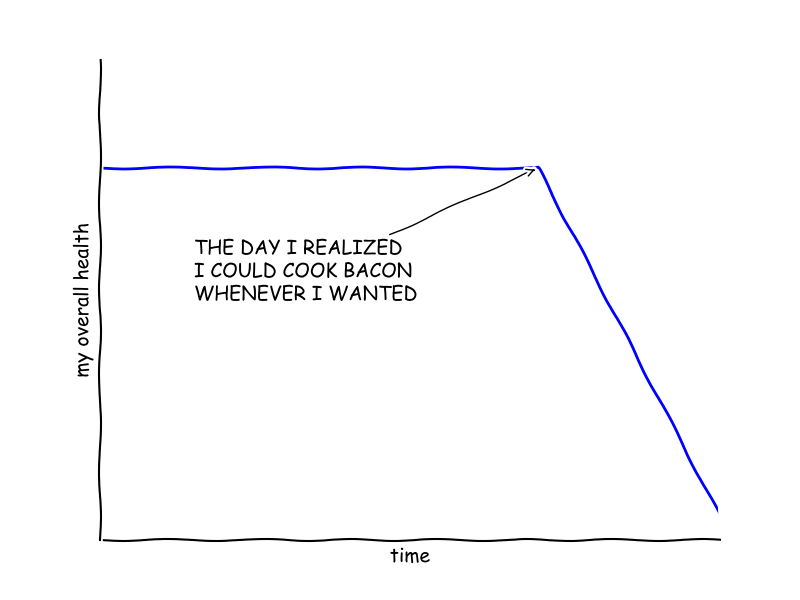
How about another example with show. This just prints the link directly. It seems to make sense to do it that way. This is from http://matplotlib.org/xkcd/examples/showcase/xkcd.html .
import pycse.orgmode as org

from matplotlib import pyplot as plt
import numpy as np

plt.xkcd()

fig = plt.figure()
ax = fig.add_subplot(1, 1, 1)
ax.spines['right'].set_color('none')
ax.spines['top'].set_color('none')
plt.xticks([])
plt.yticks([])
ax.set_ylim([-30, 10])

data = np.ones(100)
data[70:] -= np.arange(30)

plt.annotate(
    'THE DAY I REALIZED\nI COULD COOK BACON\nWHENEVER I WANTED',
    xy=(70, 1), arrowprops=dict(arrowstyle='->'), xytext=(15, -10))

plt.plot(data)

plt.xlabel('time')
plt.ylabel('my overall health')
plt.show()

# An intermediate result
print('Some intermediate result for x - 4 = 6:')
x = 6 + 4
org.fixed_width('x = {}'.format(x))

# And another figure
fig = plt.figure()
ax = fig.add_subplot(1, 1, 1)
ax.bar([-0.125, 1.0-0.125], [0, 100], 0.25)
ax.spines['right'].set_color('none')
ax.spines['top'].set_color('none')
ax.xaxis.set_ticks_position('bottom')
ax.set_xticks([0, 1])
ax.set_xlim([-0.5, 1.5])
ax.set_ylim([0, 110])
ax.set_xticklabels(['CONFIRMED BY\nEXPERIMENT', 'REFUTED BY\nEXPERIMENT'])
plt.yticks([])

plt.title("CLAIMS OF SUPERNATURAL POWERS")

plt.show()
 Some intermediate result for x - 4 = 6:
x = 10
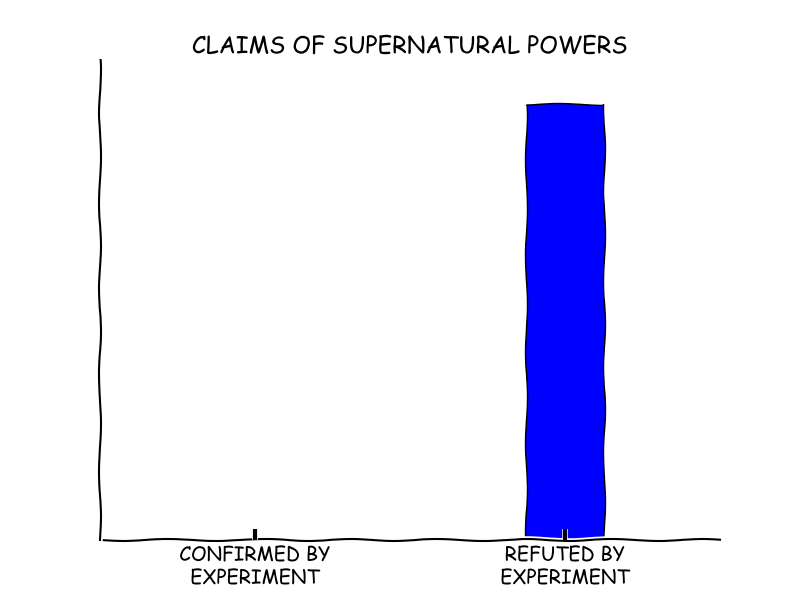
See, the figures show where they belong, with intermediate results that have some formatting, and they export correctly. Nice.
1 A Figure from Python
It has been a long desire of mine to generate full figures with captions from code blocks, and to get them where I want like this one:
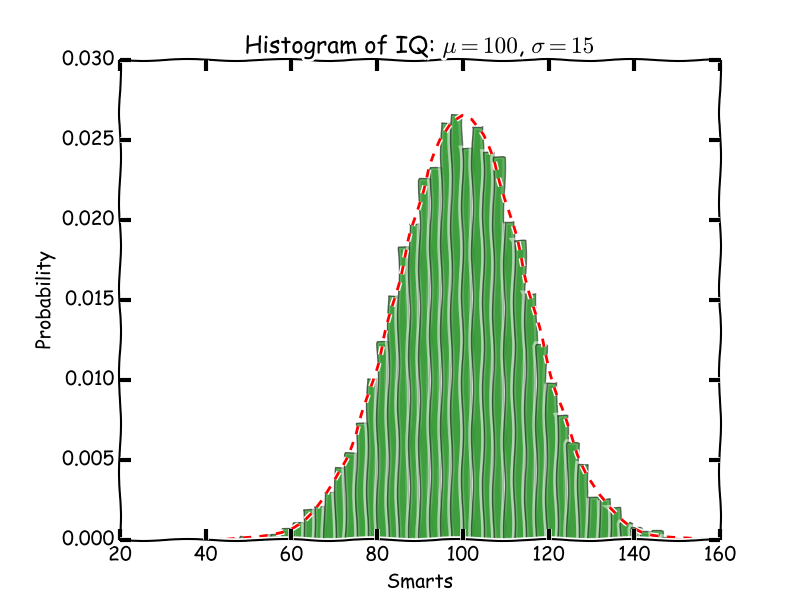
Figure 3: An italicized histogram of 10000 points
Here is the code to generate the full figure. Note we use the output of savefig as the filename. That lets us save some intermediate variable construction. That seems nice.
import pycse.orgmode as org
import matplotlib.pyplot as plt
plt.xkcd()

import numpy as np
import matplotlib.mlab as mlab
import matplotlib.pyplot as plt

# example data
mu = 100 # mean of distribution
sigma = 15 # standard deviation of distribution
x = mu + sigma * np.random.randn(10000)

num_bins = 50
# the histogram of the data
n, bins, patches = plt.hist(x, num_bins, normed=1, facecolor='green', alpha=0.5)
# add a 'best fit' line
y = mlab.normpdf(bins, mu, sigma)
plt.plot(bins, y, 'r--')
plt.xlabel('Smarts')
plt.ylabel('Probability')
plt.title(r'Histogram of IQ: $\mu=100$, $\sigma=15$')

# Tweak spacing to prevent clipping of ylabel
plt.subplots_adjust(left=0.15)

org.figure(plt.savefig('smarts.png'),
           label='fig:1',
           caption='An italicized /histogram/ of {} points'.format(len(x)),
           attributes=[('LATEX', ':width 3in'),
                       ('HTML', ':width 300'),
                       ('ORG', ':width 300')])
That is pretty awesome. You cannot put figures in more than one place like this, and you might not want to mix results with this, but it is still pretty awesome!
2 An example table.
Finally, I have wanted the same thing for tables. Here is the resulting table.
| ENCUT | Energy (eV) |
|---|---|
| 100 | 11.233 |
| 200 | 21.233 |
| 300 | 31.233 |
| 400 | 41.233 |
| 500 | 51.233 |
Here is the code block that generated it.
import pycse.orgmode as org

data = [['<5>', '<11>'],  # Column aligners
        ['ENCUT', 'Energy (eV)'],
        None]

for encut in [100, 200, 300, 400, 500]:
    data += [[encut, 1.233 + 0.1 * encut]]

org.table(data,
          name='table-1',
          caption='Dependence of the energy on the encut value.')
The only obvious improvement on this is similar to getting images to redisplay after running a code block, it might be nice to reformat tables to make sure they are pretty looking. Otherwise this is good.
Let's go ahead and try that. Here we narrow down to the results, and align the tables in that region.
(defun org-align-visible-tables ()
  "Align all the tables in the results."
  (let ((location (org-babel-where-is-src-block-result)) start)
    (when location
      (setq start (- location 1))
      (save-restriction
        (save-excursion
          (goto-char location) (forward-line 1)
          (narrow-to-region start (org-babel-result-end))
          (goto-char (point-min))
          (while (re-search-forward org-table-any-line-regexp nil t)
            (save-excursion (org-table-align))
            (or (looking-at org-table-line-regexp)
                (forward-char 1)))
          (re-search-forward org-table-any-border-regexp nil 1))))))

(add-hook 'org-babel-after-execute-hook
          (lambda () (org-align-visible-tables)))
| lambda | nil | (org-align-visible-tables) |
| lambda | nil | (org-refresh-images) |
And that seems to solve that problem now too!
3 Miscellaneous outputs
Here are some examples of getting org-output from the pycse.orgmode module.
import pycse.orgmode as org

org.verbatim('One liner verbatim')

org.verbatim('''multiline
output
   with indentation
       at a few levels
that is verbatim.''')

org.fixed_width('your basic result')

org.fixed_width('''your
  basic
    result
on a few lines.''')

# A latex block
org.latex('\(e^{i\pi} - 1 = 0\)')

org.org(r'The equation is \(E = h \nu\).')
One liner
multiline
output
   with indentation
       at a few levels
that is verbatim.
your basic result
your
  basic
    result
on a few lines.
The equation is \(E = h \nu\).
4 Summary
This looks promising to me. There are a few things to get used to, like always having org output, and some minor differences in making figures. On the whole this looks like a big improvement though! I look forward to working with it more.
Copyright (C) 2016 by John Kitchin. See the License for information about copying.
Org-mode version = 8.2.10