Adding captions and attributes to figures and tables from code blocks in org-mode
Posted February 26, 2016 at 12:43 PM | categories: orgmode | tags:
I have wanted for a long time to be able to add captions and attributes to figures and tables generated from code blocks. I brought this up on the mailing list (https://lists.gnu.org/archive/html/emacs-orgmode/2015-11/msg00544.html ) and finally, I have figured out a way to do it that seems ok. It is based on the :wrap feature of org-babel.
The idea is to use a function that will wrap the results in additional text. We use this function that will add a caption and attributes.
(defun src-decorate (&optional caption attributes)
  "A wrap function for src blocks."
  (concat
   "ORG\n"
   (when attributes
     (concat (mapconcat 'identity attributes "\n") "\n"))
   (when caption
     (format "#+caption: %s" caption))))
src-decorate
Now, we try it out on a figure:
import numpy as np
import matplotlib.pyplot as plt

x = np.linspace(0, 2 * np.pi)
y = np.sin(x)

plt.plot(x, y)
plt.savefig('images/sin.png')
print('[[./images/sin.png' + ']]')
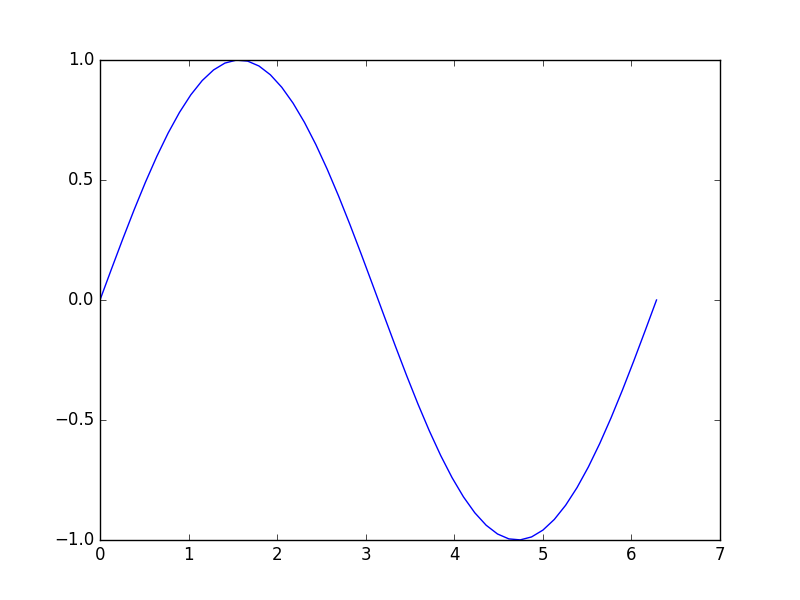
Figure 1: A sin wave.
Success. We can even refer to Fig. fig-sin. Next, we try it on a table.
import numpy as np

x = np.linspace(0, 2 * np.pi, 5)
y = np.sin(x)

return [['x', 'y'], None] + list(zip(x, y))
| x | y |
|---|---|
| 0.0 | 0.0 |
| 1.5707963267948966 | 1.0 |
| 3.141592653589793 | 1.2246467991473532e-16 |
| 4.71238898038469 | -1.0 |
| 6.283185307179586 | -2.4492935982947064e-16 |
Sweet. We can refer to Tab. tab-sin too. I have wanted this for a long time. Perseverance wins again! and org-mode gets better. Hopefully this works with org 8.3 too!
Copyright (C) 2016 by John Kitchin. See the License for information about copying.
Org-mode version = 8.2.10