Annotating matplotlib figures
Posted November 01, 2014 at 10:35 AM | categories: python matplotlib | tags:
There is a nice picture of an ethanolamine molecule here . The first thing we consider is embedding this figure in a matplotlib figure. It is a little tricky because we have to create a special axes to put the image in. The axes are created in a fractional coordinate systems that is defined by [left, bottom, width, height]. Placing the figure where you want it is an iterative process that involves changing those values to get the image where you want.
So, note that (0, 0) is the bottome left corner of the figure, and (1, 1) is the upper right corner. So, to make an axes for the main figure that takes up 75% of the width and 80% of the height, and starts 20% from the left, 15% from the bottom, we use [0.2, 0.15, 0.75, 0.8]. That covers most of the space, and leaves room for labels.
The axes for the image is about the same, but it is a little trickier to figure out the width and height. In this example these arguments appear to just rescale the image.
Here is some code that puts the image near the upper left-corner of the plot.
import matplotlib.pyplot as plt
from scipy.misc import imread
import numpy as np

im = imread('images/Ethanolamine-2D-skeletal-B.png')

fig = plt.figure(figsize=(3, 4))
#                    left bottom width height
f_ax = fig.add_axes([0.2, 0.15, 0.75, 0.8], zorder=1)

# plot some function
f_ax.plot(np.arange(10), 4 * np.arange(10))
plt.xlabel('some xlabel')
plt.ylabel('Y')

# axes for the image
i_ax = fig.add_axes([0.22, 0.8, 0.3, 0.1],
                    frameon=False, xticks=[], yticks=[],
                    zorder=2)

# add the image. zorder>1 makes sure it is on top
i_ax.imshow(im)

# print dir(i_ax)

plt.savefig('images/fig-in-plot-2.png', dpi=300)
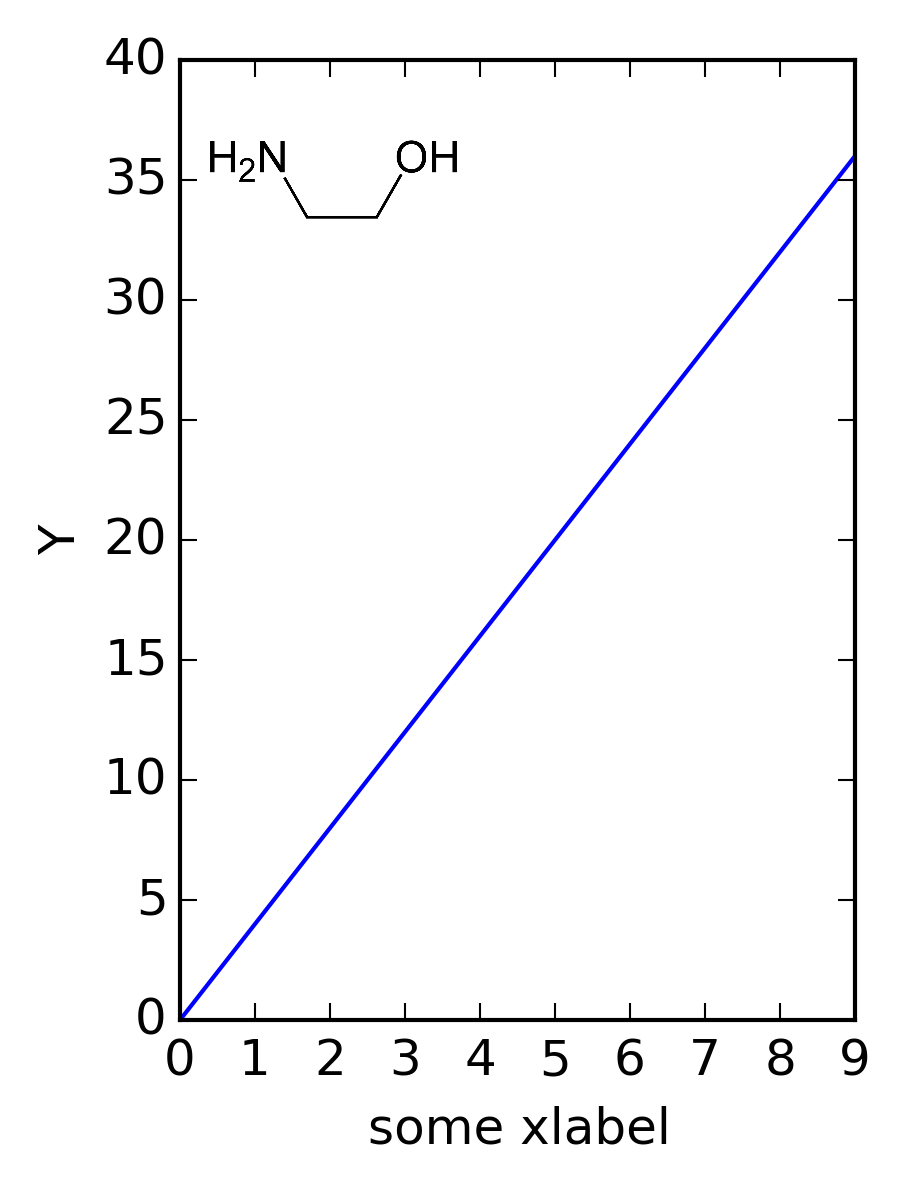
Figure 1: A matplotlib figure with an embedded images.
There it is.
Copyright (C) 2014 by John Kitchin. See the License for information about copying.
Org-mode version = 8.2.7c