Peak finding in Raman spectroscopy
Posted February 27, 2013 at 10:55 AM | categories: data analysis | tags:
Updated October 14, 2014 at 03:01 PM
Table of Contents
Raman spectroscopy is a vibrational spectroscopy. The data typically comes as intensity vs. wavenumber, and it is discrete. Sometimes it is necessary to identify the precise location of a peak. In this post, we will use spline smoothing to construct an interpolating function of the data, and then use fminbnd to identify peak positions.
This example was originally worked out in Matlab at http://matlab.cheme.cmu.edu/2012/08/27/peak-finding-in-raman-spectroscopy/
numpy:loadtxt
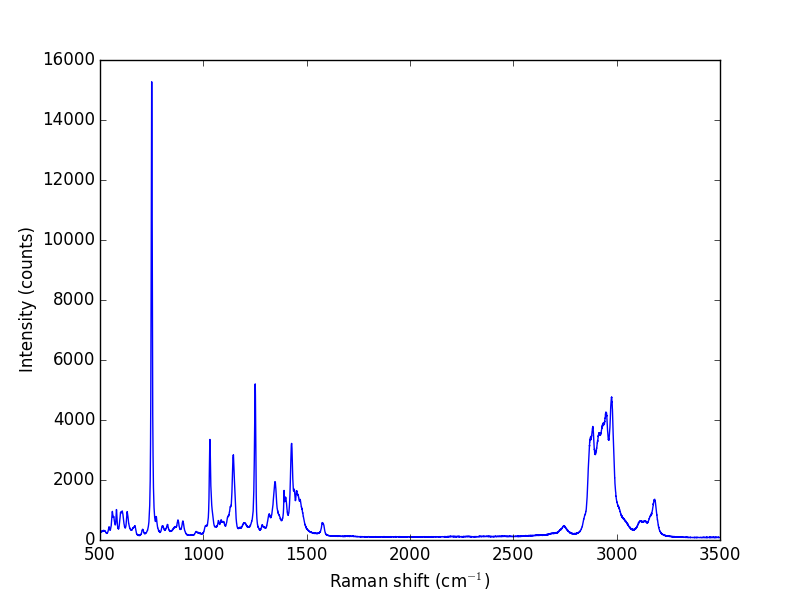
Let us take a look at the raw data.
import numpy as np
import matplotlib.pyplot as plt

w, i = np.loadtxt('data/raman.txt', usecols=(0, 1), unpack=True)

plt.plot(w, i)
plt.xlabel('Raman shift (cm$^{-1}$)')
plt.ylabel('Intensity (counts)')
plt.savefig('images/raman-1.png')
plt.show()
>>> [<matplotlib.lines.Line2D object at 0x10b1d3190>]
<matplotlib.text.Text object at 0x10b1b1b10>
<matplotlib.text.Text object at 0x10bc7f310>
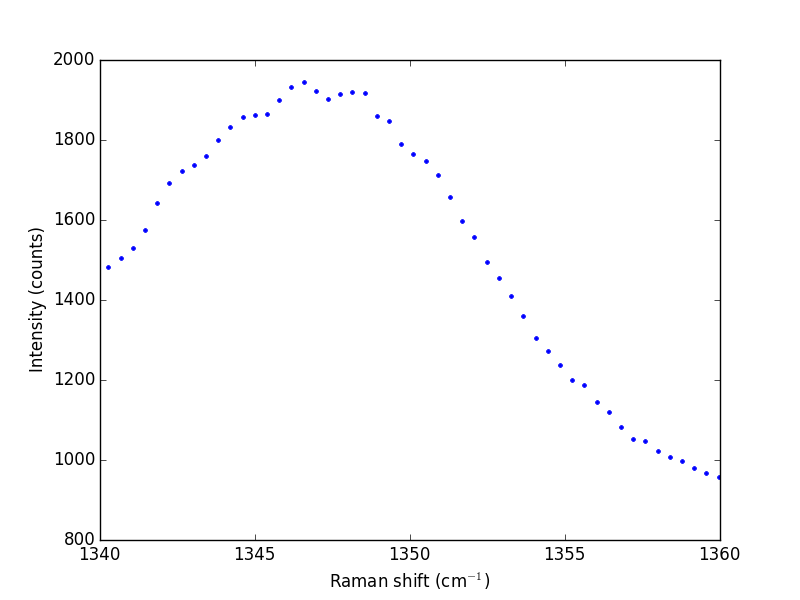
The next thing to do is narrow our focus to the region we are interested in between 1340 cm^{-1} and 1360 cm^{-1}.
ind = (w > 1340) & (w < 1360)
w1 = w[ind]
i1 = i[ind]

plt.plot(w1, i1, 'b. ')
plt.xlabel('Raman shift (cm$^{-1}$)')
plt.ylabel('Intensity (counts)')
plt.savefig('images/raman-2.png')
plt.show()
>>> >>> >>> [<matplotlib.lines.Line2D object at 0x10bc7a4d0>]
<matplotlib.text.Text object at 0x10bc08090>
<matplotlib.text.Text object at 0x10bc49710>
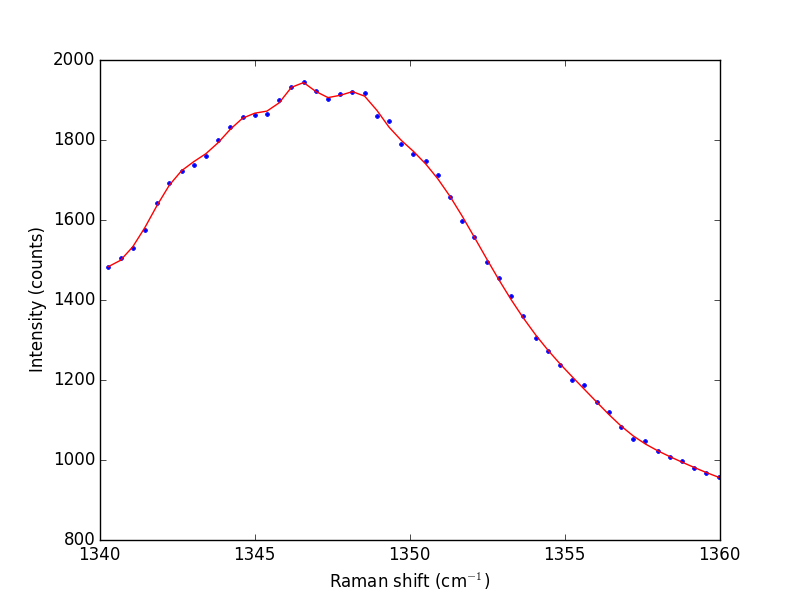
Next we consider a scipy:UnivariateSpline. This function "smooths" the data.
from scipy.interpolate import UnivariateSpline

# s is a "smoothing" factor
sp = UnivariateSpline(w1, i1, k=4, s=2000)

plt.plot(w1, i1, 'b. ')
plt.plot(w1, sp(w1), 'r-')
plt.xlabel('Raman shift (cm$^{-1}$)')
plt.ylabel('Intensity (counts)')
plt.savefig('images/raman-3.png')
plt.show()
>>> ... >>> >>> [<matplotlib.lines.Line2D object at 0x1105633d0>]
[<matplotlib.lines.Line2D object at 0x10dd70250>]
<matplotlib.text.Text object at 0x10dd65f10>
<matplotlib.text.Text object at 0x1105409d0>
Note that the UnivariateSpline function returns a "callable" function! Our next goal is to find the places where there are peaks. This is defined by the first derivative of the data being equal to zero. It is easy to get the first derivative of a UnivariateSpline with a second argument as shown below.
# get the first derivative evaluated at all the points
d1s = sp.derivative()

d1 = d1s(w1)

# we can get the roots directly here, which correspond to minima and
# maxima.
print('Roots = {}'.format(sp.derivative().roots()))
minmax = sp.derivative().roots()

plt.clf()
plt.plot(w1, d1, label='first derivative')
plt.xlabel('Raman shift (cm$^{-1}$)')
plt.ylabel('First derivative')
plt.grid()

plt.plot(minmax, d1s(minmax), 'ro ', label='zeros')
plt.legend(loc='best')

plt.plot(w1, i1, 'b. ')
plt.plot(w1, sp(w1), 'r-')
plt.xlabel('Raman shift (cm$^{-1}$)')
plt.ylabel('Intensity (counts)')
plt.plot(minmax, sp(minmax), 'ro ')

plt.savefig('images/raman-4.png')
>>> >>> >>> >>> ... ... Roots = [ 1346.4623087   1347.42700893  1348.16689639]
>>> >>> >>> [<matplotlib.lines.Line2D object at 0x1106b2dd0>]
<matplotlib.text.Text object at 0x110623910>
<matplotlib.text.Text object at 0x110c0a090>
>>> >>> [<matplotlib.lines.Line2D object at 0x10b1bacd0>]
<matplotlib.legend.Legend object at 0x1106b2650>
[<matplotlib.lines.Line2D object at 0x1106b2b50>]
[<matplotlib.lines.Line2D object at 0x110698550>]
<matplotlib.text.Text object at 0x110623910>
<matplotlib.text.Text object at 0x110c0a090>
[<matplotlib.lines.Line2D object at 0x110698a10>]
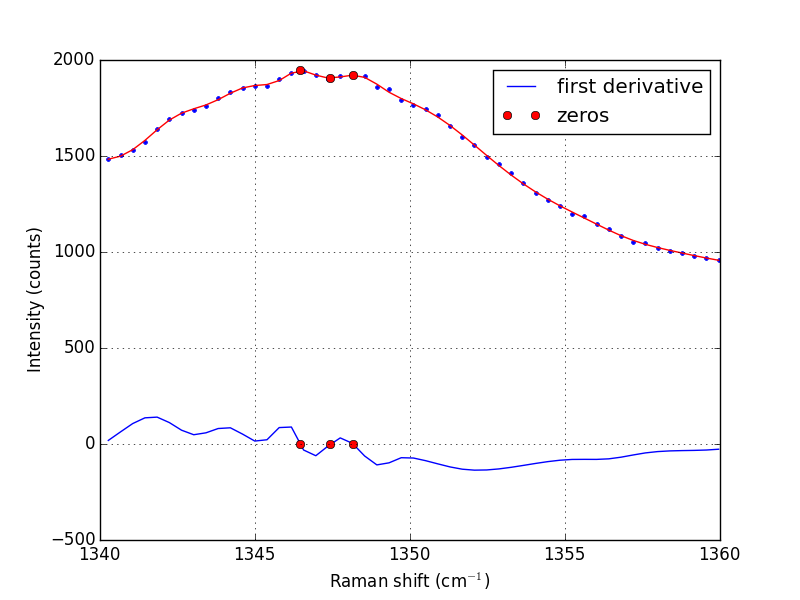
In the end, we have illustrated how to construct a spline smoothing interpolation function and to find maxima in the function, including generating some initial guesses. There is more art to this than you might like, since you have to judge how much smoothing is enough or too much. With too much, you may smooth peaks out. With too little, noise may be mistaken for peaks.
1 Summary notes
Using org-mode with :session allows a large script to be broken up into mini sections. However, it only seems to work with the default python mode in Emacs, and it does not work with emacs-for-python or the latest python-mode. I also do not really like the output style, e.g. the output from the plotting commands.
Copyright (C) 2014 by John Kitchin. See the License for information about copying.
Org-mode version = 8.2.7c