Vectorized piecewise functions
Posted February 23, 2013 at 09:00 AM | categories: math | tags:
Updated February 27, 2013 at 02:51 PM
Matlab post Occasionally we need to define piecewise functions, e.g.
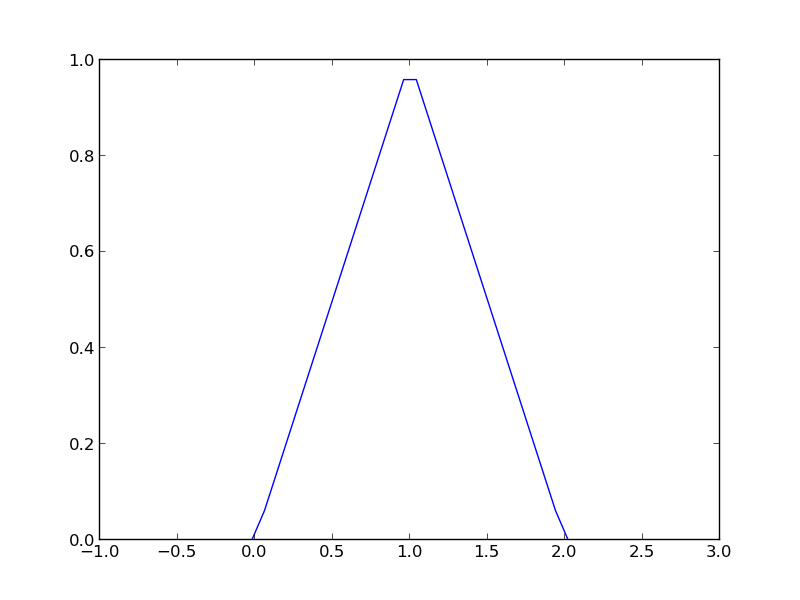
\begin{eqnarray} f(x) &=& 0, x < 0 \\ &=& x, 0 <= x < 1\\ &=& 2 - x, 1 < x <= 2\\ &=& 0, x > 2 \end{eqnarray}Today we examine a few ways to define a function like this. A simple way is to use conditional statements.
def f1(x):
    if x < 0:
        return 0
    elif (x >= 0) & (x < 1):
        return x
    elif (x >= 1) & (x < 2):
        return 2.0 - x
    else:
        return 0

print f1(-1)
print f1([0, 1, 2, 3])  # does not work!
... ... ... ... ... ... ... ... >>> 0
0
This works, but the function is not vectorized, i.e. f([-1 0 2 3]) does not evaluate properly (it should give a list or array). You can get vectorized behavior by using list comprehension, or by writing your own loop. This does not fix all limitations, for example you cannot use the f1 function in the quad function to integrate it.
import numpy as np
import matplotlib.pyplot as plt

x = np.linspace(-1, 3)
y = [f1(xx) for xx in x]

plt.plot(x, y)
plt.savefig('images/vector-piecewise.png')
>>> >>> >>> >>> >>> [<matplotlib.lines.Line2D object at 0x048D6790>]

Neither of those methods is convenient. It would be nicer if the function was vectorized, which would allow the direct notation f1([0, 1, 2, 3, 4]). A simple way to achieve this is through the use of logical arrays. We create logical arrays from comparison statements.
def f2(x):
    'fully vectorized version'
    x = np.asarray(x)
    y = np.zeros(x.shape)
    y += ((x >= 0) & (x < 1)) * x
    y += ((x >= 1) & (x < 2)) * (2 - x)
    return y

print f2([-1, 0, 1, 2, 3, 4])
x = np.linspace(-1,3);
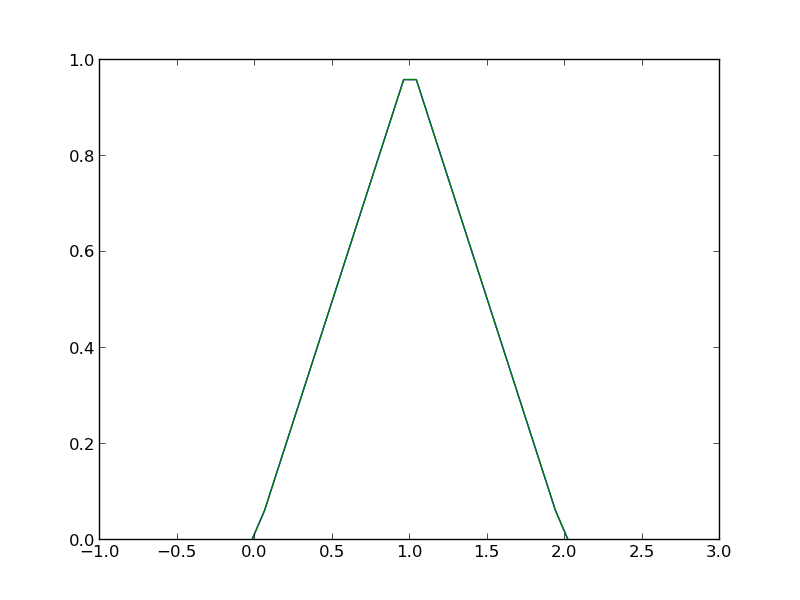
plt.plot(x,f2(x))
plt.savefig('images/vector-piecewise-2.png')
... ... ... ... ... ... >>> [ 0.  0.  1.  0.  0.  0.]
>>> [<matplotlib.lines.Line2D object at 0x043A4910>]

A third approach is to use Heaviside functions. The Heaviside function is defined to be zero for x less than some value, and 0.5 for x=0, and 1 for x >= 0. If you can live with y=0.5 for x=0, you can define a vectorized function in terms of Heaviside functions like this.
def heaviside(x):
    x = np.array(x)
    if x.shape != ():
        y = np.zeros(x.shape)
        y[x > 0.0] = 1
        y[x == 0.0] = 0.5
    else: # special case for 0d array (a number)
        if x > 0: y = 1
        elif x == 0: y = 0.5
        else: y = 0
    return y

def f3(x):
    x = np.array(x)
    y1 = (heaviside(x) - heaviside(x - 1)) * x # first interval
    y2 = (heaviside(x - 1) - heaviside(x - 2)) * (2 - x) # second interval
    return y1 + y2

from scipy.integrate import quad
print quad(f3, -1, 3)
... ... ... ... ... ... ... ... ... ... >>> ... ... ... ... ... >>> >>> (1.0, 1.1102230246251565e-14)
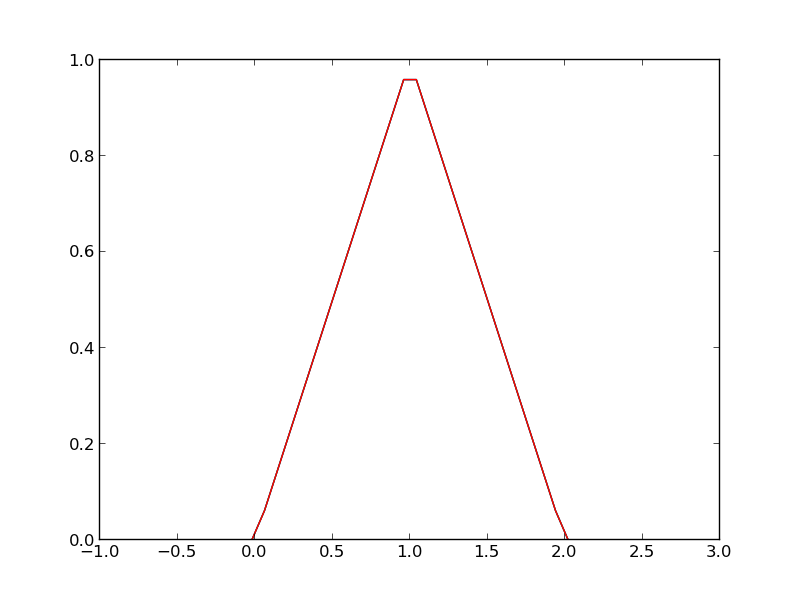
plt.plot(x, f3(x))
plt.savefig('images/vector-piecewise-3.png')
[<matplotlib.lines.Line2D object at 0x048F96F0>]

There are many ways to define piecewise functions, and vectorization is not always necessary. The advantages of vectorization are usually notational simplicity and speed; loops in python are usually very slow compared to vectorized functions.
Copyright (C) 2013 by John Kitchin. See the License for information about copying.