Fitting a numerical ODE solution to data
Posted February 18, 2013 at 09:00 AM | categories: data analysis, nonlinear regression | tags:
Updated February 27, 2013 at 02:39 PM
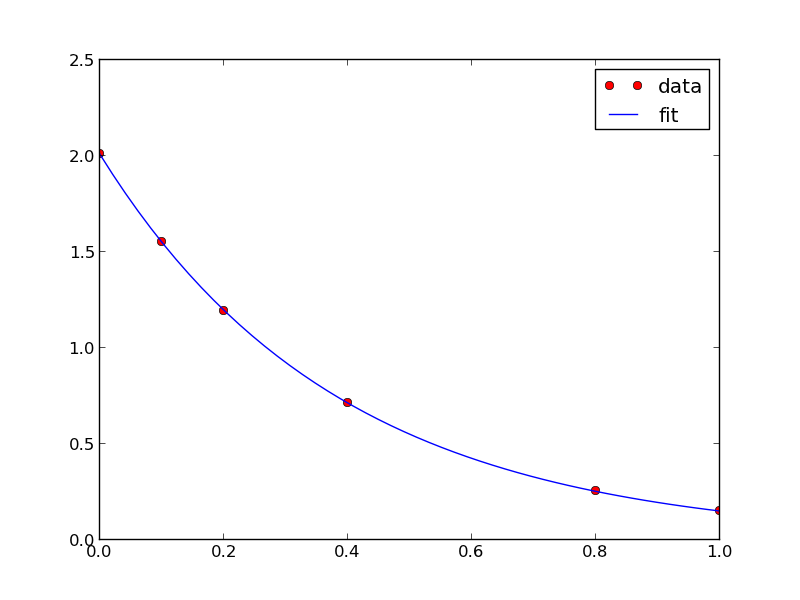
Suppose we know the concentration of A follows this differential equation: \(\frac{dC_A}{dt} = -k C_A\), and we have data we want to fit to it. Here is an example of doing that.
import numpy as np
from scipy.optimize import curve_fit
from scipy.integrate import odeint

# given data we want to fit
tspan = [0, 0.1, 0.2, 0.4, 0.8, 1]
Ca_data = [2.0081,  1.5512,  1.1903,  0.7160,  0.2562,  0.1495]

def fitfunc(t, k):
    'Function that returns Ca computed from an ODE for a k'
    def myode(Ca, t):
        return -k * Ca

    Ca0 = Ca_data[0]
    Casol = odeint(myode, Ca0, t)
    return Casol[:,0]

k_fit, kcov = curve_fit(fitfunc, tspan, Ca_data, p0=1.3)
print k_fit

tfit = np.linspace(0,1);
fit = fitfunc(tfit, k_fit)

import matplotlib.pyplot as plt
plt.plot(tspan, Ca_data, 'ro', label='data')
plt.plot(tfit, fit, 'b-', label='fit')
plt.legend(loc='best')
plt.savefig('images/ode-fit.png')
[ 2.58893455]

Copyright (C) 2013 by John Kitchin. See the License for information about copying.