Constrained minimization to find equilibrium compositions
Posted February 05, 2013 at 09:00 AM | categories: optimization | tags: thermodynamics, reaction engineering
Updated April 04, 2016 at 01:35 PM
adapated from Chemical Reactor analysis and design fundamentals, Rawlings and Ekerdt, appendix A.2.3.
The equilibrium composition of a reaction is the one that minimizes the total Gibbs free energy. The Gibbs free energy of a reacting ideal gas mixture depends on the mole fractions of each species, which are determined by the initial mole fractions of each species, the extent of reactions that convert each species, and the equilibrium constants.
Reaction 1: \(I + B \rightleftharpoons P1\)
Reaction 2: \(I + B \rightleftharpoons P2\)
Here we define the Gibbs free energy of the mixture as a function of the reaction extents.
import numpy as np

def gibbs(E):
    'function defining Gibbs free energy as a function of reaction extents'
    e1 = E[0]
    e2 = E[1]
    # known equilibrium constants and initial amounts
    K1 = 108; K2 = 284; P = 2.5
    yI0 = 0.5; yB0 = 0.5; yP10 = 0.0; yP20 = 0.0
    # compute mole fractions
    d = 1 - e1 - e2
    yI = (yI0 - e1 - e2) / d
    yB = (yB0 - e1 - e2) / d
    yP1 = (yP10 + e1) / d
    yP2 = (yP20 + e2) / d
    G = (-(e1 * np.log(K1) + e2 * np.log(K2)) +
         d * np.log(P) + yI * d * np.log(yI) +
         yB * d * np.log(yB) + yP1 * d * np.log(yP1) + yP2 * d * np.log(yP2))
    return G
The equilibrium constants for these reactions are known, and we seek to find the equilibrium reaction extents so we can determine equilibrium compositions. The equilibrium reaction extents are those that minimize the Gibbs free energy. We have the following constraints, written in standard less than or equal to form:
\(-\epsilon_1 \le 0\)
\(-\epsilon_2 \le 0\)
\(\epsilon_1 + \epsilon_2 \le 0.5\)
In Matlab we express this in matrix form as Ax=b where
\begin{equation} A = \left[ \begin{array}{cc} -1 & 0 \\ 0 & -1 \\ 1 & 1 \end{array} \right] \end{equation}and
\begin{equation} b = \left[ \begin{array}{c} 0 \\ 0 \\ 0.5\end{array} \right] \end{equation}Unlike in Matlab, in python we construct the inequality constraints as functions that are greater than or equal to zero when the constraint is met.
def constraint1(E):
    e1 = E[0]
    return e1


def constraint2(E):
    e2 = E[1]
    return e2


def constraint3(E):
    e1 = E[0]
    e2 = E[1]
    return 0.5 - (e1 + e2)
Now, we minimize.
from scipy.optimize import fmin_slsqp

X0 = [0.2, 0.2]
X = fmin_slsqp(gibbs, X0, ieqcons=[constraint1, constraint2, constraint3],
               bounds=((0.001, 0.499),
                       (0.001, 0.499)))
print(X)

print(gibbs(X))
Optimization terminated successfully.    (Exit mode 0)
            Current function value: -2.55942394906
            Iterations: 7
            Function evaluations: 31
            Gradient evaluations: 7
[ 0.13336503  0.35066486]
-2.55942394906
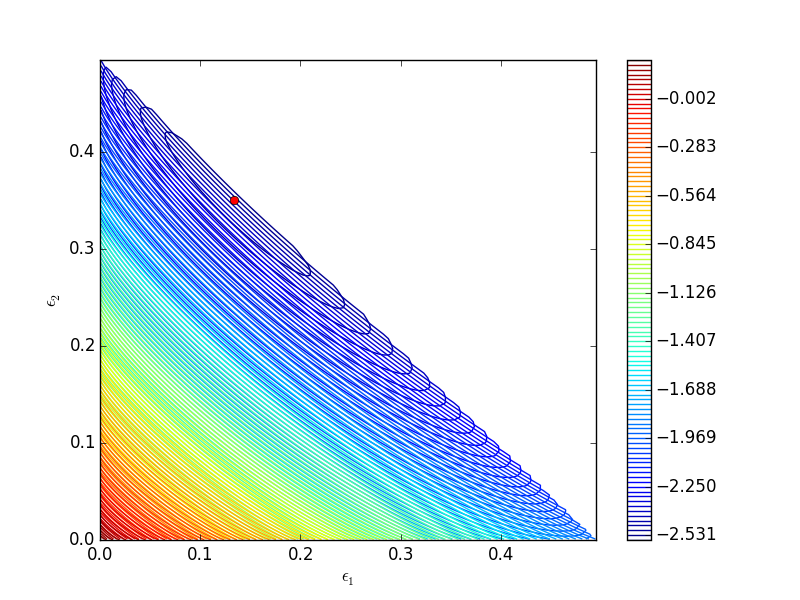
One way we can verify our solution is to plot the gibbs function and see where the minimum is, and whether there is more than one minimum. We start by making grids over the range of 0 to 0.5. Note we actually start slightly above zero because at zero there are some numerical imaginary elements of the gibbs function or it is numerically not defined since there are logs of zero there. We also set all elements where the sum of the two extents is greater than 0.5 to near zero, since those regions violate the constraints.
import numpy as np
import matplotlib.pyplot as plt

def gibbs(E):
    'function defining Gibbs free energy as a function of reaction extents'
    e1 = E[0]
    e2 = E[1]
    # known equilibrium constants and initial amounts
    K1 = 108; K2 = 284; P = 2.5;
    yI0 = 0.5; yB0 = 0.5; yP10 = 0.0; yP20 = 0.0;
    # compute mole fractions
    d = 1 - e1 - e2;
    yI = (yI0 - e1 - e2)/d;
    yB = (yB0 - e1 - e2)/d;
    yP1 = (yP10 + e1)/d;
    yP2 = (yP20 + e2)/d;
    G = (-(e1 * np.log(K1) + e2 * np.log(K2)) +
         d * np.log(P) + yI * d * np.log(yI) +
         yB * d * np.log(yB) + yP1 * d * np.log(yP1) + yP2 * d * np.log(yP2))
    return G


a = np.linspace(0.001, 0.5, 100)
E1, E2 = np.meshgrid(a,a)

sumE = E1 + E2
E1[sumE >= 0.5] = 0.00001
E2[sumE >= 0.5] = 0.00001

# now evaluate gibbs
G = np.zeros(E1.shape)
m,n = E1.shape

G = gibbs([E1, E2])

CS = plt.contour(E1, E2, G, levels=np.linspace(G.min(),G.max(),100))
plt.xlabel('$\epsilon_1$')
plt.ylabel('$\epsilon_2$')
plt.colorbar()

plt.plot([0.13336503],  [0.35066486], 'ro')

plt.savefig('images/gibbs-minimization-1.png')
plt.savefig('images/gibbs-minimization-1.svg')
plt.show()

You can see we found the minimum. We can compute the mole fractions pretty easily.
e1 = X[0];
e2 = X[1];

yI0 = 0.5; yB0 = 0.5; yP10 = 0; yP20 = 0; #initial mole fractions

d = 1 - e1 - e2;
yI = (yI0 - e1 - e2) / d
yB = (yB0 - e1 - e2) / d
yP1 = (yP10 + e1) / d
yP2 = (yP20 + e2) / d

print('y_I = {0:1.3f} y_B = {1:1.3f} y_P1 = {2:1.3f} y_P2 = {3:1.3f}'.format(yI,yB,yP1,yP2))
y_I = 0.031 y_B = 0.031 y_P1 = 0.258 y_P2 = 0.680
1 summary
I found setting up the constraints in this example to be more confusing than the Matlab syntax.
Copyright (C) 2016 by John Kitchin. See the License for information about copying.
Org-mode version = 8.2.10