Uncertainty in implicit functions

| categories: statistics | tags:

Suppose we have an equation \(y = e^{a y}\) that we want to solve, where \(a\) is a constant with some uncertainty. What is the uncertainty in the solution \(y\)?

Finding a solution is not difficult. The uncertainty in the solution, however, is not easy, since we do not have an explicit function to propagate errors through. Let us examine the solution first.

import numpy as np
from scipy.optimize import fsolve

a = 0.20

def f(y):
    return y - np.exp(a * y)

sol, = fsolve(f, 1)
print sol
1.2958555091

A way to estimate the uncertainty is by Monte Carlo simulation. We solve the equation many times, using values sampled from the uncertainty distribution. Here we assume that the \(a\) parameter is normally distributed with an average of 0.2 and a std deviation of 0.02. We solve the equation 10000 times for different values of \(a\) sampled according to the normal distribution. That gives us a distribution of solutions that we can do statistical analysis of to get the average and std deviation.

import numpy as np
from scipy.optimize import fsolve
N = 10000

A = np.random.normal(0.2, 0.02, size=N)

sol = np.zeros(A.shape)

for i, a in enumerate(A):
    s, = fsolve(lambda y:y - np.exp(a * y), 1)
    sol[i] = s

ybar = np.mean(sol)
s_y = np.std(sol)

print ybar, s_y, s_y / ybar

import matplotlib.pyplot as plt
count, bins, ignored = plt.hist(sol)
plt.savefig('images/implicit-uncertainty.png')
1.29887470397 0.0465110111613 0.0358086973433

We get approximately the same answer, and you can see here the distribution of solution values is not quite normal. We compute the standard deviation anyway, and find the standard deviation is about 3.6%. It would be nice to have some analytical method to estimate this uncertainty. So far I have not figured that out.

This method could have relevance in estimating the uncertainty in the friction factor for turbulent flow (\(Re > 2100\)). In that case we have the implicit equation \(\frac{1}{\sqrt{f_F}}=4.0 \log(Re \sqrt{f_F})-0.4\). Uncertainties in the Re number would lead to uncertainties in the friction factor. Whether those uncertainties are larger than the uncertainties from the original correlation would require some investigation.

Copyright (C) 2013 by John Kitchin. See the License for information about copying.

org-mode source

Discuss on Twitter

Another approach to error propagation

| categories: statistics | tags:

In the previous section we examined an analytical approach to error propagation, and a simulation based approach. There is another approach to error propagation, using the uncertainties module (https://pypi.python.org/pypi/uncertainties/). You have to install this package, e.g. pip install uncertainties. After that, the module provides new classes of numbers and functions that incorporate uncertainty and propagate the uncertainty through the functions. In the examples that follow, we repeat the calculations from the previous section using the uncertainties module.

Addition and subtraction

import uncertainties as u

A = u.ufloat((2.5, 0.4))
B = u.ufloat((4.1, 0.3))
print A + B
print A - B
>>> >>> >>> 6.6+/-0.5
-1.6+/-0.5

Multiplication and division

F = u.ufloat((25, 1))
x = u.ufloat((6.4, 0.4))

t = F * x
print t

d = F / x
print d
>>> >>> >>> 160.0+/-11.8726576637
>>> >>> 3.90625+/-0.289859806243

Exponentiation

t = u.ufloat((2.03, 0.0203))
print t**5

from uncertainties.umath import sqrt
A = u.ufloat((16.07, 0.06))
print sqrt(A)
# print np.sqrt(A) # this does not work

from uncertainties import unumpy as unp
print unp.sqrt(A)
34.4730881243+/-1.72365440621
>>> >>> >>> >>> 4.00874045057+/-0.00748364738749
... >>> >>> 4.00874045057+/-0.00748364738749

Note in the last example, we had to either import a function from uncertainties.umath or import a special version of numpy that handles uncertainty. This may be a limitation of teh uncertainties package as not all functions in arbitrary modules can be covered. Note, however, that you can wrap a function to make it handle uncertainty like this.

import numpy as np

wrapped_sqrt = u.wrap(np.sqrt)
print wrapped_sqrt(A)
>>> >>> 4.00874045057+/-0.00748364738774

Propagation of errors in an integral

import numpy as np
import uncertainties as u

x = np.array([u.ufloat((1, 0.01)), 
              u.ufloat((2, 0.1)),
              u.ufloat((3, 0.1))])

y = 2 * x

print np.trapz(x, y)
>>> >>> ... ... >>> >>> >>> >>> 8.0+/-0.600333240792

Chain rule in error propagation

v0 = u.ufloat((1.2, 0.02))
a = u.ufloat((3.0, 0.3))
t = u.ufloat((12.0, 0.12))

v = v0 + a * t
print v
>>> >>> >>> >>> 37.2+/-3.61801050303

A real example? This is what I would setup for a real working example. We try to compute the exit concentration from a CSTR. The idea is to wrap the “external” fsolve function using the uncertainties.wrap function, which handles the units. Unfortunately, it does not work, and it is not clear why. But see the following discussion for a fix.

from scipy.optimize import fsolve

Fa0 = u.ufloat((5.0, 0.05))
v0 = u.ufloat((10., 0.1))

V = u.ufloat((66000.0, 100))  # reactor volume L^3
k = u.ufloat((3.0, 0.2))      # rate constant L/mol/h

def func(Ca):
    "Mole balance for a CSTR. Solve this equation for func(Ca)=0"
    Fa = v0 * Ca     # exit molar flow of A
    ra = -k * Ca**2  # rate of reaction of A L/mol/h
    return Fa0 - Fa + V * ra

# CA guess that that 90 % is reacted away
CA_guess = 0.1 * Fa0 / v0

wrapped_fsolve = u.wrap(fsolve)
CA_sol = wrapped_fsolve(func, CA_guess)

print 'The exit concentration is {0} mol/L'.format(CA_sol)
>>> >>> >>> >>> >>> >>> >>> ... ... ... ... ... >>> ... >>> >>> >>> <function fsolve at 0x148f25f0>
>>> >>> The exit concentration is NotImplemented mol/L

I got a note from the author of the uncertainties package explaining the cryptic error above, and a solution for it. The error arises because fsolve does not know how to deal with uncertainties. The idea is to create a function that returns a float, when everything is given as a float. Then, we wrap the fsolve call, and finally wrap the wrapped fsolve call!

  • Step 1. Write the function to solve with arguments for all unitted quantities. This function may be called with uncertainties, or with floats.
  • Step 2. Wrap the call to fsolve in a function that takes all the parameters as arguments, and that returns the solution.
  • Step 3. Use uncertainties.wrap to wrap the function in Step 2 to get the answer with uncertainties.

Here is the code that does work:

import uncertainties as u
from scipy.optimize import fsolve

Fa0 = u.ufloat((5.0, 0.05))
v0 = u.ufloat((10., 0.1))

V = u.ufloat((66000.0, 100.0))  # reactor volume L^3
k = u.ufloat((3.0, 0.2))      # rate constant L/mol/h

# Step 1
def func(Ca, v0, k, Fa0, V):
    "Mole balance for a CSTR. Solve this equation for func(Ca)=0"
    Fa = v0 * Ca     # exit molar flow of A
    ra = -k * Ca**2  # rate of reaction of A L/mol/h
    return Fa0 - Fa + V * ra

# Step 2
def Ca_solve(v0, k, Fa0, V): 
    'wrap fsolve to pass parameters as float or units'
    # this line is a little fragile. You must put [0] at the end or
    # you get the NotImplemented result
    sol = fsolve(func, 0.1 * Fa0 / v0, args=(v0, k, Fa0, V))[0]
    return sol

# Step 3
print u.wrap(Ca_solve)(v0, k, Fa0, V)
0.005+/-0.000167764327667

It would take some practice to get used to this, but the payoff is that you have an “automatic” error propagation method.

Being ever the skeptic, let us compare the result above to the Monte Carlo approach to error estimation below.

import numpy as np
from scipy.optimize import fsolve

N = 10000
Fa0 = np.random.normal(5, 0.05, (1, N))
v0 = np.random.normal(10.0, 0.1, (1, N))
V =  np.random.normal(66000, 100, (1,N))
k = np.random.normal(3.0, 0.2, (1, N))

SOL = np.zeros((1, N))

for i in range(N):
    def func(Ca):
        return Fa0[0,i] - v0[0,i] * Ca + V[0,i] * (-k[0,i] * Ca**2)
    SOL[0,i] = fsolve(func, 0.1 * Fa0[0,i] / v0[0,i])[0]

print 'Ca(exit) = {0}+/-{1}'.format(np.mean(SOL), np.std(SOL))
Ca(exit) = 0.00500829453185+/-0.000169103578901

I am pretty content those are the same!

1 Summary

The uncertainties module is pretty amazing. It automatically propagates errors through a pretty broad range of computations. It is a little tricky for third-party packages, but it seems doable.

Read more about the package at http://pythonhosted.org/uncertainties/index.html.

Copyright (C) 2013 by John Kitchin. See the License for information about copying.

org-mode source

Discuss on Twitter

Model selection

| categories: data analysis, statistics | tags:

Matlab post

adapted from http://www.itl.nist.gov/div898/handbook/pmd/section4/pmd44.htm

In this example, we show some ways to choose which of several models fit data the best. We have data for the total pressure and temperature of a fixed amount of a gas in a tank that was measured over the course of several days. We want to select a model that relates the pressure to the gas temperature.

The data is stored in a text file download PT.txt , with the following structure:

Run          Ambient                            Fitted
 Order  Day  Temperature  Temperature  Pressure    Value    Residual
  1      1      23.820      54.749      225.066   222.920     2.146
...

We need to read the data in, and perform a regression analysis on P vs. T. In python we start counting at 0, so we actually want columns 3 and 4.

import numpy as np
import matplotlib.pyplot as plt

data = np.loadtxt('data/PT.txt', skiprows=2)
T = data[:, 3]
P = data[:, 4]

plt.plot(T, P, 'k.')
plt.xlabel('Temperature')
plt.ylabel('Pressure')
plt.savefig('images/model-selection-1.png')
>>> >>> >>> >>> >>> >>> [<matplotlib.lines.Line2D object at 0x00000000084398D0>]
<matplotlib.text.Text object at 0x000000000841F6A0>
<matplotlib.text.Text object at 0x0000000008423DD8>
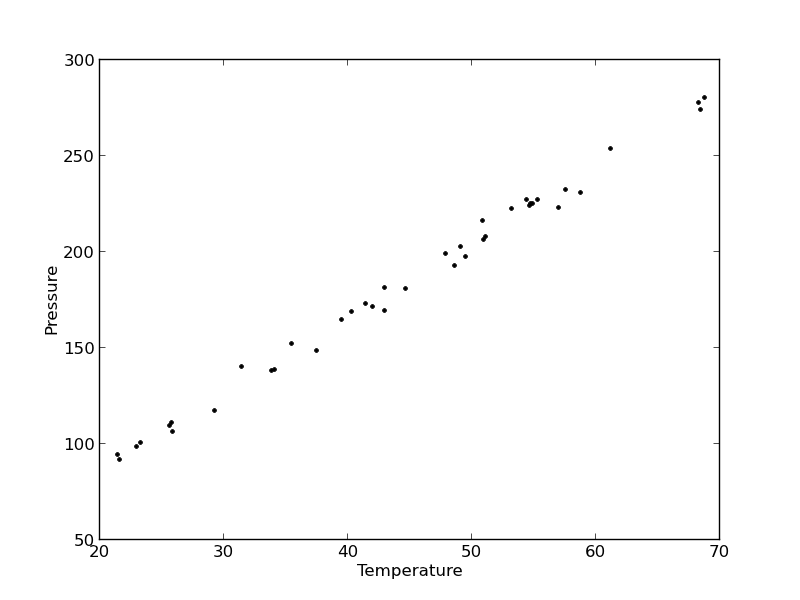
It appears the data is roughly linear, and we know from the ideal gas law that PV = nRT, or P = nR/V*T, which says P should be linearly correlated with V. Note that the temperature data is in degC, not in K, so it is not expected that P=0 at T = 0. We will use linear algebra to compute the line coefficients.

A = np.vstack([T**0, T]).T
b = P

x, res, rank, s = np.linalg.lstsq(A, b)
intercept, slope = x
print 'b, m =', intercept, slope

n = len(b)
k = len(x)

sigma2 = np.sum((b - np.dot(A,x))**2) / (n - k)

C = sigma2 * np.linalg.inv(np.dot(A.T, A))
se = np.sqrt(np.diag(C))

from scipy.stats.distributions import  t
alpha = 0.05

sT = t.ppf(1-alpha/2., n - k) # student T multiplier
CI = sT * se

print 'CI = ',CI
for beta, ci in zip(x, CI):
    print '[{0} {1}]'.format(beta - ci, beta + ci)
>>> >>> >>> >>> b, m = 7.74899739238 3.93014043824
>>> >>> >>> >>> >>> >>> >>> >>> >>> >>> >>> >>> >>> >>> >>> CI =  [ 4.76511545  0.1026405 ]
... ... [2.98388194638 12.5141128384]
[3.82749994079 4.03278093569]

The confidence interval on the intercept is large, but it does not contain zero at the 95% confidence level.

The R^2 value accounts roughly for the fraction of variation in the data that can be described by the model. Hence, a value close to one means nearly all the variations are described by the model, except for random variations.

ybar = np.mean(P)
SStot = np.sum((P - ybar)**2)
SSerr = np.sum((P - np.dot(A, x))**2)
R2 = 1 - SSerr/SStot
print R2
>>> >>> >>> 0.993715411798
plt.figure(); plt.clf()
plt.plot(T, P, 'k.', T, np.dot(A, x), 'b-')
plt.xlabel('Temperature')
plt.ylabel('Pressure')
plt.title('R^2 = {0:1.3f}'.format(R2))
plt.savefig('images/model-selection-2.png')
<matplotlib.figure.Figure object at 0x0000000008423860>
[<matplotlib.lines.Line2D object at 0x00000000085BE780>, <matplotlib.lines.Line2D object at 0x00000000085BE940>]
<matplotlib.text.Text object at 0x0000000008449898>
<matplotlib.text.Text object at 0x000000000844CCF8>
<matplotlib.text.Text object at 0x000000000844ED30>
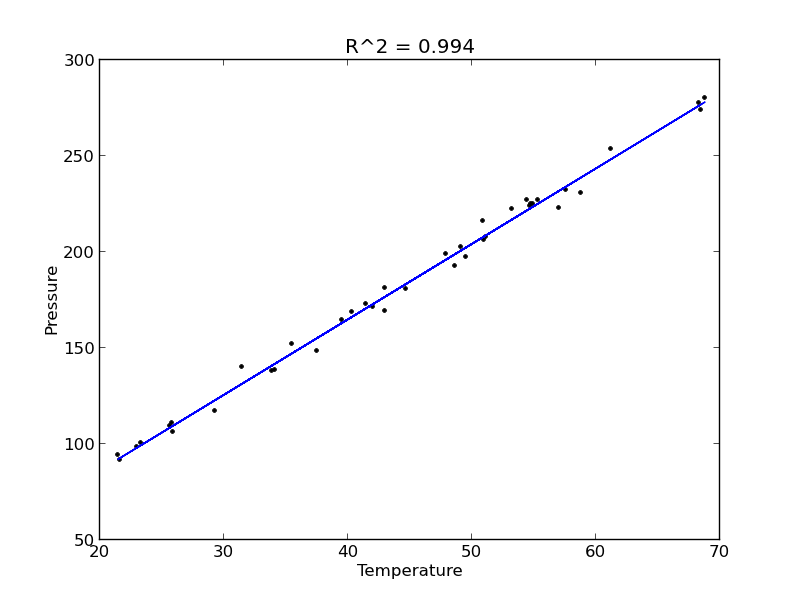
The fit looks good, and R^2 is near one, but is it a good model? There are a few ways to examine this. We want to make sure that there are no systematic trends in the errors between the fit and the data, and we want to make sure there are not hidden correlations with other variables. The residuals are the error between the fit and the data. The residuals should not show any patterns when plotted against any variables, and they do not in this case.

residuals = P - np.dot(A, x)

plt.figure()

f, (ax1, ax2, ax3) = plt.subplots(3)

ax1.plot(T,residuals,'ko')
ax1.set_xlabel('Temperature')


run_order = data[:, 0]
ax2.plot(run_order, residuals,'ko ')
ax2.set_xlabel('run order')

ambientT = data[:, 2]
ax3.plot(ambientT, residuals,'ko')
ax3.set_xlabel('ambient temperature')

plt.tight_layout() # make sure plots do not overlap

plt.savefig('images/model-selection-3.png')
>>> <matplotlib.figure.Figure object at 0x00000000085C21D0>
>>> >>> >>> [<matplotlib.lines.Line2D object at 0x0000000008861CC0>]
<matplotlib.text.Text object at 0x00000000085D3A58>
>>> >>> >>> [<matplotlib.lines.Line2D object at 0x0000000008861E80>]
<matplotlib.text.Text object at 0x00000000085EC5F8>
>>> >>> [<matplotlib.lines.Line2D object at 0x0000000008861C88>]
<matplotlib.text.Text object at 0x0000000008846828>
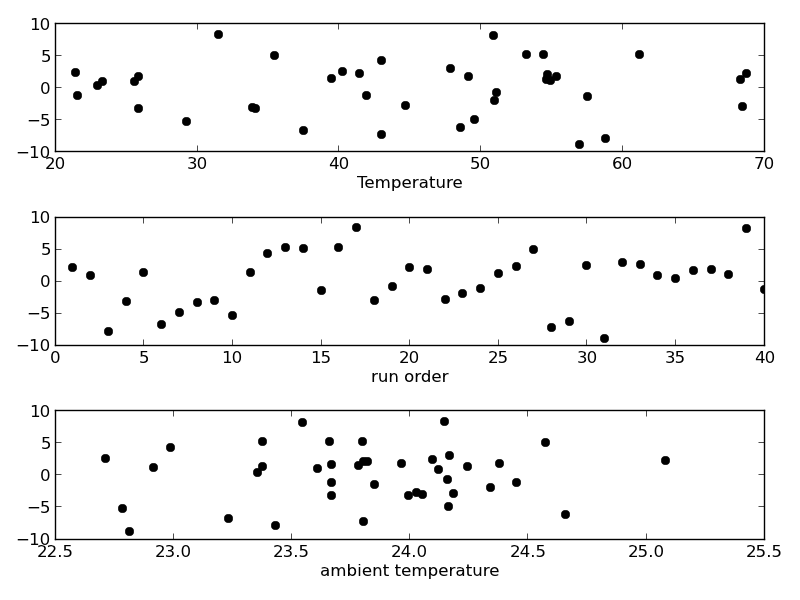
There may be some correlations in the residuals with the run order. That could indicate an experimental source of error.

We assume all the errors are uncorrelated with each other. We can use a lag plot to assess this, where we plot residual[i] vs residual[i-1], i.e. we look for correlations between adjacent residuals. This plot should look random, with no correlations if the model is good.

plt.figure(); plt.clf()
plt.plot(residuals[1:-1], residuals[0:-2],'ko')
plt.xlabel('residual[i]')
plt.ylabel('residual[i-1]')
plt.savefig('images/model-selection-correlated-residuals.png')
<matplotlib.figure.Figure object at 0x000000000886EB00>
[<matplotlib.lines.Line2D object at 0x0000000008A02908>]
<matplotlib.text.Text object at 0x00000000089E8198>
<matplotlib.text.Text object at 0x00000000089EB908>
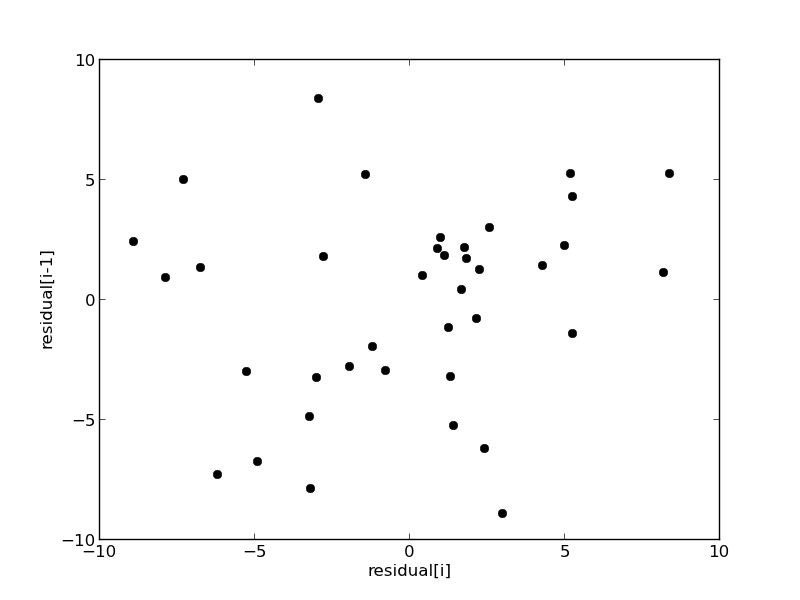
It is hard to argue there is any correlation here.

Lets consider a quadratic model instead.

A = np.vstack([T**0, T, T**2]).T
b = P;

x, res, rank, s = np.linalg.lstsq(A, b)
print x

n = len(b)
k = len(x)

sigma2 = np.sum((b - np.dot(A,x))**2) / (n - k)

C = sigma2 * np.linalg.inv(np.dot(A.T, A))
se = np.sqrt(np.diag(C))

from scipy.stats.distributions import  t
alpha = 0.05

sT = t.ppf(1-alpha/2., n - k) # student T multiplier
CI = sT * se

print 'CI = ',CI
for beta, ci in zip(x, CI):
    print '[{0} {1}]'.format(beta - ci, beta + ci)


ybar = np.mean(P)
SStot = np.sum((P - ybar)**2)
SSerr = np.sum((P - np.dot(A,x))**2)
R2 = 1 - SSerr/SStot
print 'R^2 = {0}'.format(R2)
>>> >>> >>> [  9.00353031e+00   3.86669879e+00   7.26244301e-04]
>>> >>> >>> >>> >>> >>> >>> >>> >>> >>> >>> >>> >>> >>> >>> CI =  [  1.38030344e+01   6.62100654e-01   7.48516727e-03]
... ... [-4.79950412123 22.8065647329]
[3.20459813681 4.52879944409]
[-0.00675892296907 0.00821141157035]
>>> >>> >>> >>> >>> R^2 = 0.993721969407

You can see that the confidence interval on the constant and T^2 term includes zero. That is a good indication this additional parameter is not significant. You can see also that the R^2 value is not better than the one from a linear fit, so adding a parameter does not increase the goodness of fit. This is an example of overfitting the data. Since the constant in this model is apparently not significant, let us consider the simplest model with a fixed intercept of zero.

Let us consider a model with intercept = 0, P = alpha*T.

A = np.vstack([T]).T
b = P;

x, res, rank, s = np.linalg.lstsq(A, b)

n = len(b)
k = len(x)

sigma2 = np.sum((b - np.dot(A,x))**2) / (n - k)

C = sigma2 * np.linalg.inv(np.dot(A.T, A))
se = np.sqrt(np.diag(C))

from scipy.stats.distributions import  t
alpha = 0.05

sT = t.ppf(1-alpha/2.0, n - k) # student T multiplier
CI = sT * se

for beta, ci in zip(x, CI):
    print '[{0} {1}]'.format(beta - ci, beta + ci)

plt.figure()
plt.plot(T, P, 'k. ', T, np.dot(A, x))
plt.xlabel('Temperature')
plt.ylabel('Pressure')
plt.legend(['data', 'fit'])

ybar = np.mean(P)
SStot = np.sum((P - ybar)**2)
SSerr = np.sum((P - np.dot(A,x))**2)
R2 = 1 - SSerr/SStot
plt.title('R^2 = {0:1.3f}'.format(R2))
plt.savefig('images/model-selection-no-intercept.png')
>>> >>> >>> >>> >>> >>> >>> >>> >>> >>> >>> >>> >>> >>> >>> >>> >>> >>> ... ... [4.05680124495 4.12308349899]
<matplotlib.figure.Figure object at 0x0000000008870BE0>
[<matplotlib.lines.Line2D object at 0x00000000089F4550>, <matplotlib.lines.Line2D object at 0x00000000089F4208>]
<matplotlib.text.Text object at 0x0000000008A13630>
<matplotlib.text.Text object at 0x0000000008A16DA0>
<matplotlib.legend.Legend object at 0x00000000089EFD30>
>>> >>> >>> >>> >>> <matplotlib.text.Text object at 0x000000000B26C0B8>
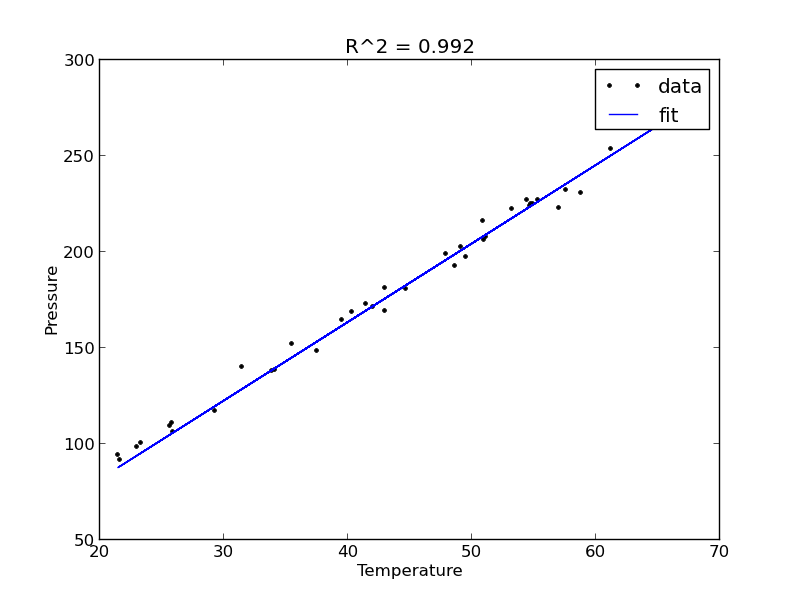
The fit is visually still pretty good, and the R^2 value is only slightly worse. Let us examine the residuals again.

residuals = P - np.dot(A,x)

plt.figure()
plt.plot(T,residuals,'ko')
plt.xlabel('Temperature')
plt.ylabel('residuals')
plt.savefig('images/model-selection-no-incpt-resid.png')
>>> <matplotlib.figure.Figure object at 0x0000000008A0F5C0>
[<matplotlib.lines.Line2D object at 0x000000000B29B0F0>]
<matplotlib.text.Text object at 0x000000000B276FD0>
<matplotlib.text.Text object at 0x000000000B283780>
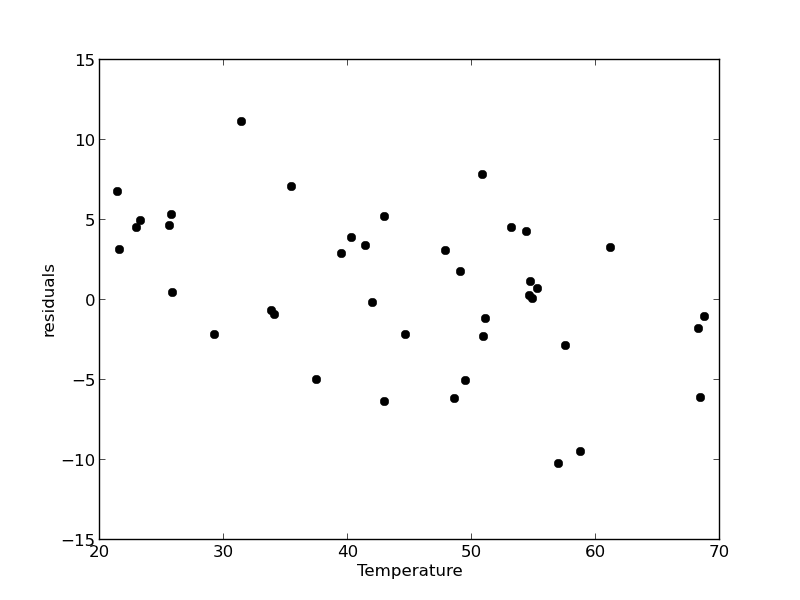
You can see a slight trend of decreasing value of the residuals as the Temperature increases. This may indicate a deficiency in the model with no intercept. For the ideal gas law in degC: \(PV = nR(T+273)\) or \(P = nR/V*T + 273*nR/V\), so the intercept is expected to be non-zero in this case. Specifically, we expect the intercept to be 273*R*n/V. Since the molar density of a gas is pretty small, the intercept may be close to, but not equal to zero. That is why the fit still looks ok, but is not as good as letting the intercept be a fitting parameter. That is an example of the deficiency in our model.

In the end, it is hard to justify a model more complex than a line in this case.

Copyright (C) 2013 by John Kitchin. See the License for information about copying.

org-mode source

Discuss on Twitter

Random thoughts

| categories: statistics, math | tags:

Matlab post

Random numbers are used in a variety of simulation methods, most notably Monte Carlo simulations. In another later example, we will see how we can use random numbers for error propagation analysis. First, we discuss two types of pseudorandom numbers we can use in python: uniformly distributed and normally distributed numbers.

Say you are the gambling type, and bet your friend $5 the next random number will be greater than 0.49. Let us ask Python to roll the random number generator for us.

import numpy as np

n = np.random.uniform()
print 'n = {0}'.format(n)

if n > 0.49:
    print 'You win!'
else:
    print 'you lose.'
n = 0.381896986693
you lose.

The odds of you winning the last bet are slightly stacked in your favor. There is only a 49% chance your friend wins, but a 51% chance that you win. Lets play the game a lot of times times and see how many times you win, and your friend wins. First, lets generate a bunch of numbers and look at the distribution with a histogram.

import numpy as np

N = 10000
games = np.random.uniform(size=(1,N))

wins = np.sum(games > 0.49)
losses = N - wins

print 'You won {0} times ({1:%})'.format(wins, float(wins) / N)

import matplotlib.pyplot as plt
count, bins, ignored = plt.hist(games)
plt.savefig('images/random-thoughts-1.png')
You won 5090 times (50.900000%)

As you can see you win slightly more than you lost.

It is possible to get random integers. Here are a few examples of getting a random integer between 1 and 100. You might do this to get random indices of a list, for example.

import numpy as np

print np.random.random_integers(1, 100)
print np.random.random_integers(1, 100, 3)
print np.random.random_integers(1, 100, (2,2))
96
[ 95  49 100]
[[69 54]
 [41 93]]

The normal distribution is defined by \(f(x)=\frac{1}{\sqrt{2\pi \sigma^2}} \exp (-\frac{(x-\mu)^2}{2\sigma^2})\) where \(\mu\) is the mean value, and \(\sigma\) is the standard deviation. In the standard distribution, \(\mu=0\) and \(\sigma=1\).

import numpy as np

mu = 1
sigma = 0.5
print np.random.normal(mu, sigma)
print np.random.normal(mu, sigma, 2)
1.04225842065
[ 0.58105204  0.64853157]

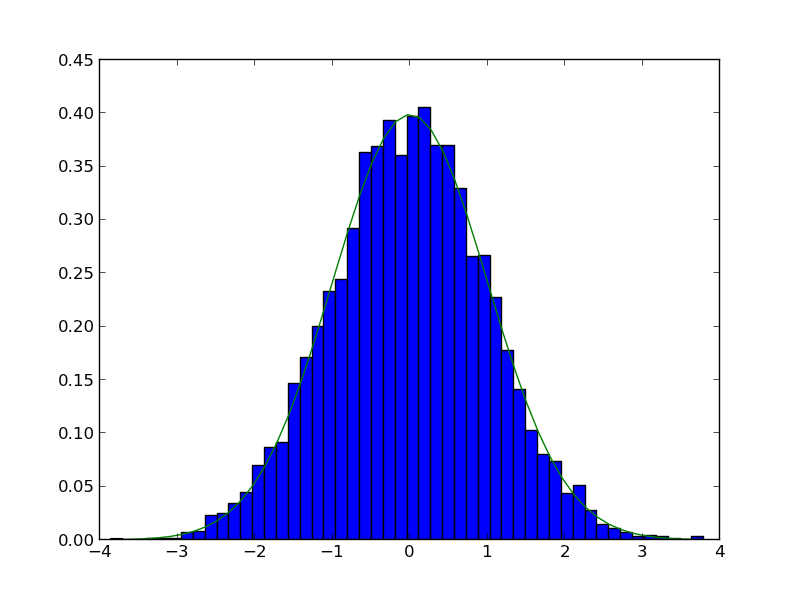
Let us compare the sampled distribution to the analytical distribution. We generate a large set of samples, and calculate the probability of getting each value using the matplotlib.pyplot.hist command.

import numpy as np
import matplotlib.pyplot as plt

mu = 0; sigma = 1

N = 5000
samples = np.random.normal(mu, sigma, N)

counts, bins, ignored = plt.hist(samples, 50, normed=True)

plt.plot(bins, 1.0/np.sqrt(2 * np.pi * sigma**2)*np.exp(-((bins - mu)**2)/(2*sigma**2)))
plt.savefig('images/random-thoughts-2.png')

What fraction of points lie between plus and minus one standard deviation of the mean?

samples >= mu-sigma will return a vector of ones where the inequality is true, and zeros where it is not. (samples >= mu-sigma) & (samples <= mu+sigma) will return a vector of ones where there is a one in both vectors, and a zero where there is not. In other words, a vector where both inequalities are true. Finally, we can sum the vector to get the number of elements where the two inequalities are true, and finally normalize by the total number of samples to get the fraction of samples that are greater than -sigma and less than sigma.

import numpy as np
import matplotlib.pyplot as plt

mu = 0; sigma = 1

N = 5000
samples = np.random.normal(mu, sigma, N)

a = np.sum((samples >= (mu - sigma)) & (samples <= (mu + sigma))) / float(N) 
b = np.sum((samples >= (mu - 2*sigma)) & (samples <= (mu + 2*sigma))) / float(N) 
print '{0:%} of samples are within +- standard deviations of the mean'.format(a)
print '{0:%} of samples are within +- 2standard deviations of the mean'.format(b)
67.500000% of samples are within +- standard deviations of the mean
95.580000% of samples are within +- 2standard deviations of the mean

1 Summary

We only considered the numpy.random functions here, and not all of them. There are many distributions of random numbers to choose from. There are also random numbers in the python random module. Remember these are only pseudorandom numbers, but they are still useful for many applications.

Copyright (C) 2013 by John Kitchin. See the License for information about copying.

org-mode source

Discuss on Twitter

Are averages different

| categories: data analysis, statistics | tags:

Matlab post

Adapted from http://stattrek.com/ap-statistics-4/unpaired-means.aspx

Class A had 30 students who received an average test score of 78, with standard deviation of 10. Class B had 25 students an average test score of 85, with a standard deviation of 15. We want to know if the difference in these averages is statistically relevant. Note that we only have estimates of the true average and standard deviation for each class, and there is uncertainty in those estimates. As a result, we are unsure if the averages are really different. It could have just been luck that a few students in class B did better.

The hypothesis:

the true averages are the same. We need to perform a two-sample t-test of the hypothesis that \(\mu_1 - \mu_2 = 0\) (this is often called the null hypothesis). we use a two-tailed test because we do not care if the difference is positive or negative, either way means the averages are not the same.

import numpy as np

n1 = 30  # students in class A
x1 = 78.0  # average grade in class A
s1 = 10.0  # std dev of exam grade in class A

n2 = 25  # students in class B
x2 = 85.0  # average grade in class B
s2 = 15.0  # std dev of exam grade in class B

# the standard error of the difference between the two averages. 
SE = np.sqrt(s1**2 / n1 + s2**2 / n2)

# compute DOF
DF = (n1 - 1) + (n2 - 1)

see the discussion at http://stattrek.com/Help/Glossary.aspx?Target=Two-sample%20t-test for a more complex definition of degrees of freedom. Here we simply subtract one from each sample size to account for the estimation of the average of each sample.

compute the t-score for our data

The difference between two averages determined from small sample numbers follows the t-distribution. the t-score is the difference between the difference of the means and the hypothesized difference of the means, normalized by the standard error. we compute the absolute value of the t-score to make sure it is positive for convenience later.

tscore = np.abs(((x1 - x2) - 0) / SE)
print tscore
1.99323179108

Interpretation

A way to approach determinining if the difference is significant or not is to ask, does our computed average fall within a confidence range of the hypothesized value (zero)? If it does, then we can attribute the difference to statistical variations at that confidence level. If it does not, we can say that statistical variations do not account for the difference at that confidence level, and hence the averages must be different.

Let us compute the t-value that corresponds to a 95% confidence level for a mean of zero with the degrees of freedom computed earlier. This means that 95% of the t-scores we expect to get will fall within \(\pm\) t95.

from scipy.stats.distributions import  t

ci = 0.95;
alpha = 1 - ci;
t95 = t.ppf(1.0 - alpha/2.0, DF)

print t95
>>> >>> >>> >>> >>> 2.00574599354

since tscore < t95, we conclude that at the 95% confidence level we cannot say these averages are statistically different because our computed t-score falls in the expected range of deviations. Note that our t-score is very close to the 95% limit. Let us consider a smaller confidence interval.

ci = 0.94
alpha = 1 - ci;
t95 = t.ppf(1.0 - alpha/2.0, DF)

print t95
>>> >>> >>> 1.92191364181

at the 94% confidence level, however, tscore > t94, which means we can say with 94% confidence that the two averages are different; class B performed better than class A did. Alternatively, there is only about a 6% chance we are wrong about that statement. another way to get there

An alternative way to get the confidence that the averages are different is to directly compute it from the cumulative t-distribution function. We compute the difference between all the t-values less than tscore and the t-values less than -tscore, which is the fraction of measurements that are between them. You can see here that we are practically 95% sure that the averages are different.

f = t.cdf(tscore, DF) - t.cdf(-tscore, DF)
print f
0.948605075732

Copyright (C) 2013 by John Kitchin. See the License for information about copying.

org-mode source

Discuss on Twitter
Next Page ยป