Reproducing the research
Posted February 04, 2014 at 07:26 AM | categories: org-mode | tags:
We have over the past year published a few papers using org-mode. You can find one of them here: http://pubs.acs.org/doi/abs/10.1021/ie400582a . There is a corresponding supporting information file that is freely available, which contains within it an org-mode file that documents our work, and that contains the data in it. In this post, I want to explore how easy it is to access that data, and use it. First, download the file:
wget http://pubs.acs.org/doi/suppl/10.1021/ie400582a/suppl_file/ie400582a_si_001.pdf
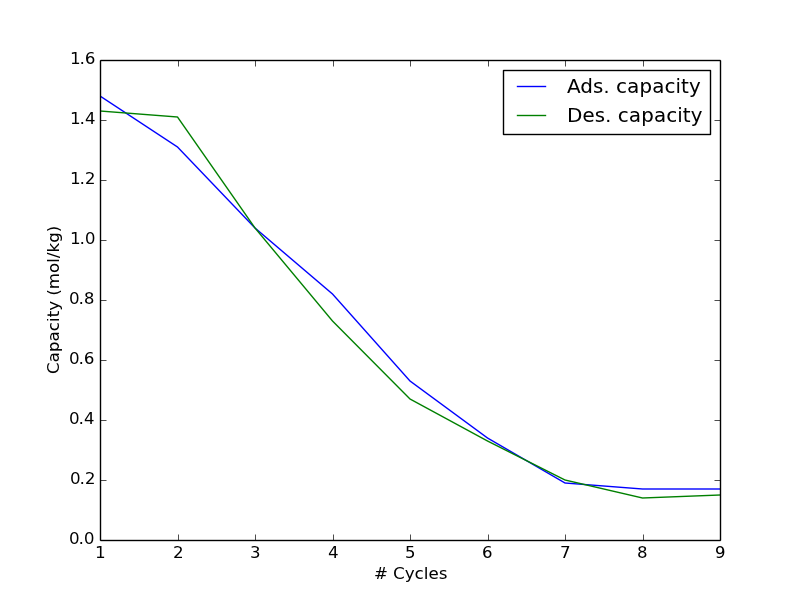
Then, open it in Acrobat Reader, and extract the org-file. I saved it as supporting-information.org . In that file, there is a table of data that is the SO2 adsorption and desorption capacity of a resin as a function of cycles. The table is named so2-capacity-1.
Here is how simple it is to grab that data, and use it. We need to use this header in our source block:
#+BEGIN_SRC python :var data=supporting-information.org:so2-capacity-1
In the block, data will be a list of lists. I like to convert it into a numpy array, so that indexing it is simple to extract out the data.
import numpy as np
data = np.array(data)
cycles = data[:, 0]
ads_cap = data[:, 1]
des_cap = data[:, 2]

import matplotlib.pyplot as plt
plt.plot(cycles, ads_cap, cycles, des_cap)
plt.legend(['Ads. capacity', 'Des. capacity'])
plt.xlabel('# Cycles')
plt.ylabel('Capacity (mol/kg)')
plt.savefig('images/si-image.png')

That is pretty easy. There are also Excel sheets embedded in that supporting information file, along with scripts that illustrate how to use the data in the Excel sheets for further analysis. How about that for data sharing!
Copyright (C) 2014 by John Kitchin. See the License for information about copying.
Org-mode version = 8.2.5h