Customizing plots after the fact
Posted September 16, 2013 at 04:27 PM | categories: plotting | tags:
Updated September 16, 2013 at 04:32 PM
Matlab post Sometimes it is desirable to make a plot that shows the data you want to present, and to customize the details, e.g. font size/type and line thicknesses afterwards. It can be tedious to try to add the customization code to the existing code that makes the plot. Today, we look at a way to do the customization after the plot is created.
import numpy as np
import matplotlib.pyplot as plt

x = np.linspace(0,2)
y1 = x
y2 = x**2
y3 = x**3

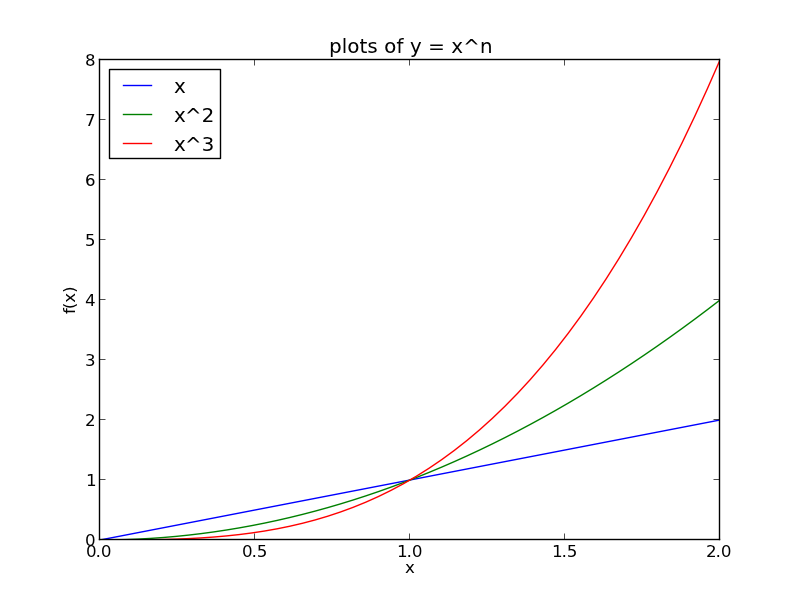
plt.plot(x, y1, x, y2, x, y3)
xL = plt.xlabel('x')
yL = plt.ylabel('f(x)')
plt.title('plots of y = x^n')
plt.legend(['x', 'x^2', 'x^3'], loc='best')
plt.savefig('images/after-customization-1.png')

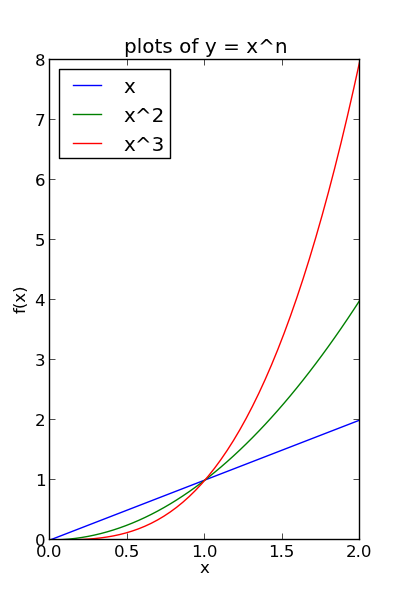
fig = plt.gcf()

plt.setp(fig, 'size_inches', (4, 6))
plt.savefig('images/after-customization-2.png')


# set lines to dashed
from matplotlib.lines import Line2D
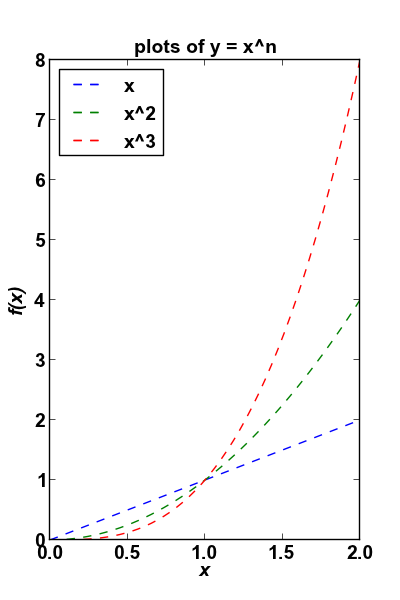
for o in fig.findobj(Line2D):
    o.set_linestyle('--')

#set(allaxes,'FontName','Arial','FontWeight','Bold','LineWidth',2,'FontSize',14);

import matplotlib.text as text
for o in fig.findobj(text.Text):
    plt.setp(o, 'fontname','Arial', 'fontweight','bold', 'fontsize', 14)

plt.setp(xL, 'fontstyle', 'italic')
plt.setp(yL, 'fontstyle', 'italic')
plt.savefig('images/after-customization-3.png')
plt.show()


Copyright (C) 2013 by John Kitchin. See the License for information about copying.