Plotting two datasets with very different scales
Posted September 13, 2013 at 01:55 PM | categories: plotting | tags:
Updated June 19, 2014 at 03:26 PM
Table of Contents
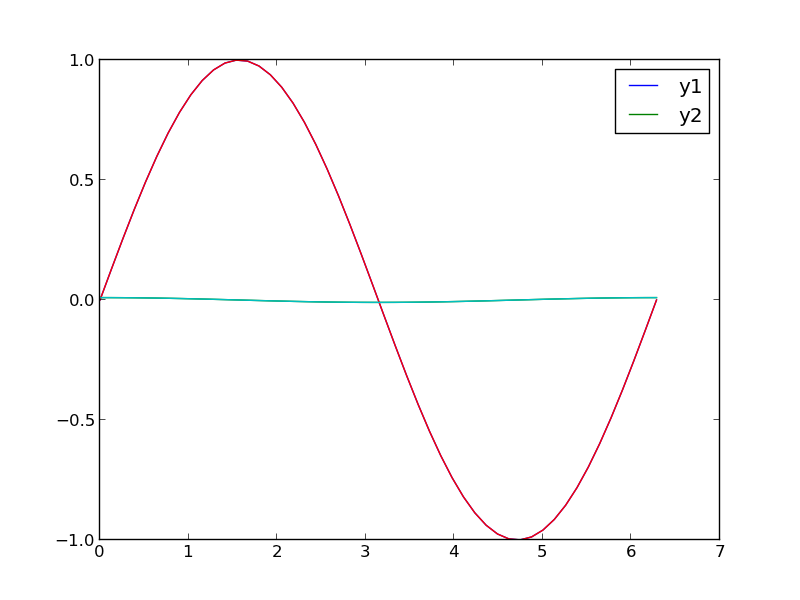
Sometimes you will have two datasets you want to plot together, but the scales will be so different it is hard to seem them both in the same plot. Here we examine a few strategies to plotting this kind of data.
import numpy as np
import matplotlib.pyplot as plt

x = np.linspace(0, 2*np.pi)
y1 = np.sin(x);
y2 = 0.01 * np.cos(x);

plt.plot(x, y1, x, y2)
plt.legend(['y1', 'y2'])
plt.savefig('images/two-scales-1.png')
# in this plot y2 looks almost flat!
>>> >>> >>> >>> >>> >>> [<matplotlib.lines.Line2D object at 0x0000000006089128>, <matplotlib.lines.Line2D object at 0x000000000766B2E8>]
<matplotlib.legend.Legend object at 0x0000000007661668>
1 Make two plots!
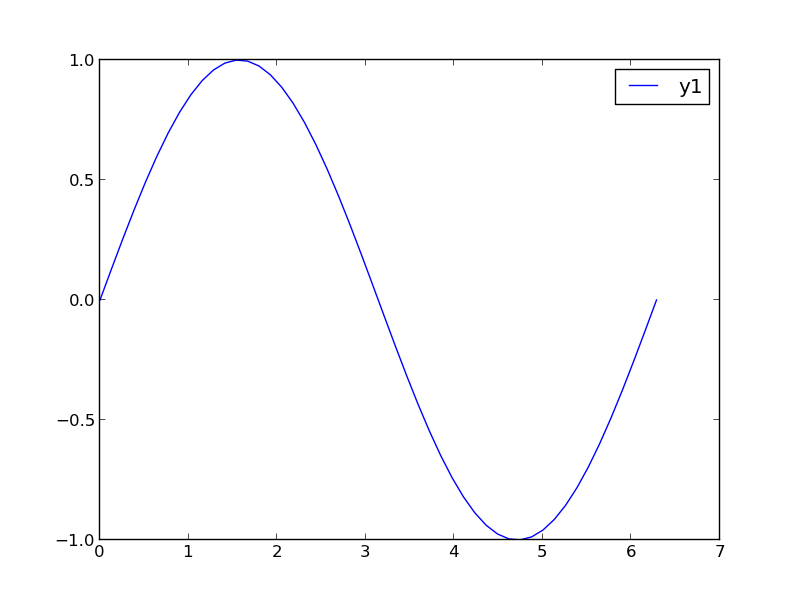
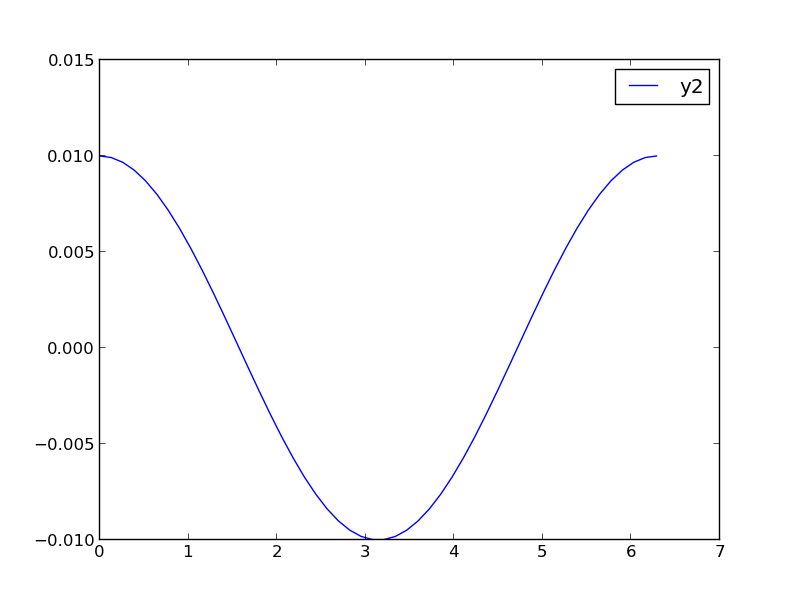
this certainly solves the problem, but you have two full size plots, which can take up a lot of space in a presentation and report. Often your goal in plotting both data sets is to compare them, and it is easiest to compare plots when they are perfectly lined up. Doing that manually can be tedious.
plt.figure()
plt.plot(x,y1)
plt.legend(['y1'])
plt.savefig('images/two-scales-2.png')

plt.figure()
plt.plot(x,y2)
plt.legend(['y2'])
plt.savefig('images/two-scales-3.png')
<matplotlib.figure.Figure object at 0x0000000007D45438>
[<matplotlib.lines.Line2D object at 0x00000000081C61D0>]
<matplotlib.legend.Legend object at 0x0000000007FA1CF8>
>>> >>> <matplotlib.figure.Figure object at 0x00000000081C63C8>
[<matplotlib.lines.Line2D object at 0x00000000081C8F60>]
<matplotlib.legend.Legend object at 0x00000000081D7278>
2 Scaling the results
Sometimes you can scale one dataset so it has a similar magnitude as the other data set. Here we could multiply y2 by 100, and then it will be similar in size to y1. Of course, you need to indicate that y2 has been scaled in the graph somehow. Here we use the legend.
plt.figure()
plt.plot(x, y1, x, 100 * y2)
plt.legend(['y1', '100*y2'])
plt.savefig('images/two-scales-4.png')
<matplotlib.figure.Figure object at 0x0000000007FA7908>
[<matplotlib.lines.Line2D object at 0x000000000B0285C0>, <matplotlib.lines.Line2D object at 0x000000000B0287B8>]
<matplotlib.legend.Legend object at 0x000000000B028C88>

3 Double-y axis plot
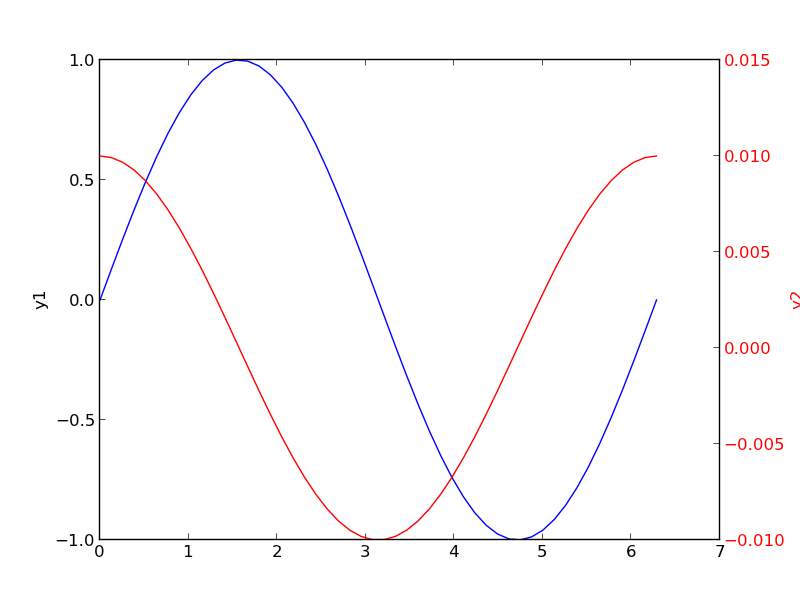
Using two separate y-axes can solve your scaling problem. Note that each y-axis is color coded to the data. It can be difficult to read these graphs when printed in black and white
fig = plt.figure()
ax1 = fig.add_subplot(111)
ax1.plot(x, y1)
ax1.set_ylabel('y1')

ax2 = ax1.twinx()
ax2.plot(x, y2, 'r-')
ax2.set_ylabel('y2', color='r')
for tl in ax2.get_yticklabels():
    tl.set_color('r')

plt.savefig('images/two-scales-5.png')
>>> [<matplotlib.lines.Line2D object at 0x000000000BA34208>]
<matplotlib.text.Text object at 0x000000000BA37C50>
>>> >>> [<matplotlib.lines.Line2D object at 0x000000000BA4DEF0>]
<matplotlib.text.Text object at 0x000000000BA594A8>
4 Subplots
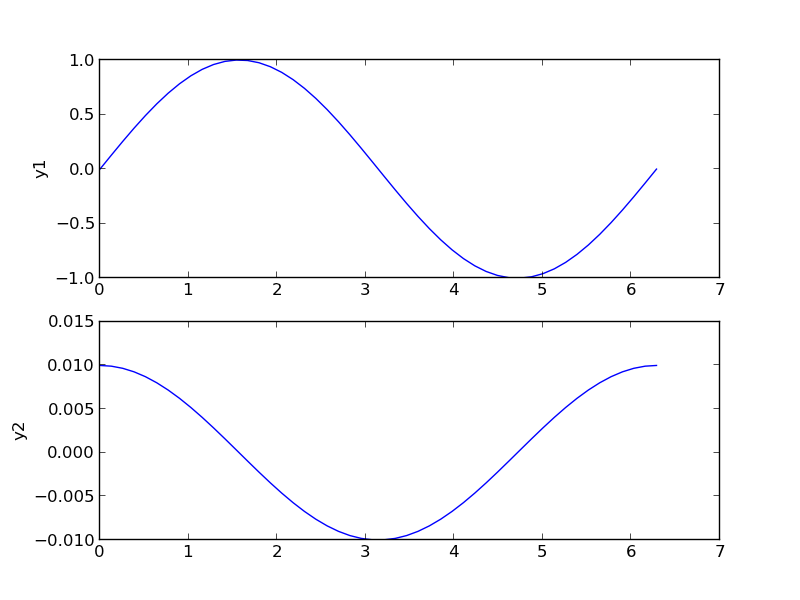
An alternative approach to double y axes is to use subplots.
plt.figure()
f, axes = plt.subplots(2, 1)
axes[0].plot(x, y1)
axes[0].set_ylabel('y1')

axes[1].plot(x, y2)
axes[1].set_ylabel('y2')
plt.savefig('images/two-scales-6.png')
<matplotlib.figure.Figure object at 0x000000000BDC47B8>
>>> [<matplotlib.lines.Line2D object at 0x000000000BDE2F28>]
<matplotlib.text.Text object at 0x000000000BDD74E0>
>>> [<matplotlib.lines.Line2D object at 0x000000000D05E748>]
<matplotlib.text.Text object at 0x000000000BDEC438>
Copyright (C) 2014 by John Kitchin. See the License for information about copying.
Org-mode version = 8.2.6