Phase portraits of a system of ODEs
Posted February 21, 2013 at 09:00 AM | categories: ode, math | tags:
Updated February 27, 2013 at 02:56 PM
Matlab post An undamped pendulum with no driving force is described by
$$ y'' + sin(y) = 0$$
We reduce this to standard matlab form of a system of first order ODEs by letting \(y_1 = y\) and \(y_2=y_1'\). This leads to:
\(y_1' = y_2\)
\(y_2' = -sin(y_1)\)
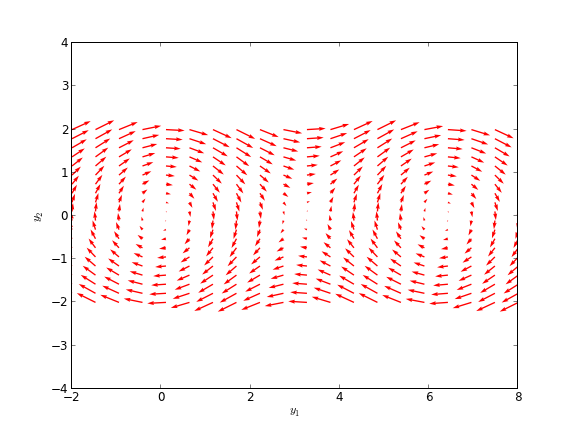
The phase portrait is a plot of a vector field which qualitatively shows how the solutions to these equations will go from a given starting point. here is our definition of the differential equations:
To generate the phase portrait, we need to compute the derivatives \(y_1'\) and \(y_2'\) at \(t=0\) on a grid over the range of values for \(y_1\) and \(y_2\) we are interested in. We will plot the derivatives as a vector at each (y1, y2) which will show us the initial direction from each point. We will examine the solutions over the range -2 < y1 < 8, and -2 < y2 < 2 for y2, and create a grid of 20 x 20 points.
import numpy as np
import matplotlib.pyplot as plt

def f(Y, t):
    y1, y2 = Y
    return [y2, -np.sin(y1)]

y1 = np.linspace(-2.0, 8.0, 20)
y2 = np.linspace(-2.0, 2.0, 20)

Y1, Y2 = np.meshgrid(y1, y2)

t = 0

u, v = np.zeros(Y1.shape), np.zeros(Y2.shape)

NI, NJ = Y1.shape

for i in range(NI):
    for j in range(NJ):
        x = Y1[i, j]
        y = Y2[i, j]
        yprime = f([x, y], t)
        u[i,j] = yprime[0]
        v[i,j] = yprime[1]


Q = plt.quiver(Y1, Y2, u, v, color='r')

plt.xlabel('$y_1$')
plt.ylabel('$y_2$')
plt.xlim([-2, 8])
plt.ylim([-4, 4])
plt.savefig('images/phase-portrait.png')
>>> ... >>> >>> >>> >>> >>> >>> ... ... ... >>> >>> <matplotlib.text.Text object at 0xbcfd290>
<matplotlib.text.Text object at 0xbd14750>
(-2, 8)
(-4, 4)

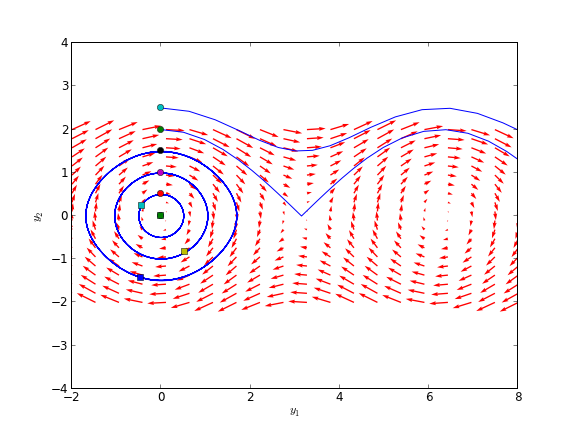
Let us plot a few solutions on the vector field. We will consider the solutions where y1(0)=0, and values of y2(0) = [0 0.5 1 1.5 2 2.5], in otherwords we start the pendulum at an angle of zero, with some angular velocity.
from scipy.integrate import odeint

for y20 in [0, 0.5, 1, 1.5, 2, 2.5]:
    tspan = np.linspace(0, 50, 200)
    y0 = [0.0, y20]
    ys = odeint(f, y0, tspan)
    plt.plot(ys[:,0], ys[:,1], 'b-') # path
    plt.plot([ys[0,0]], [ys[0,1]], 'o') # start
    plt.plot([ys[-1,0]], [ys[-1,1]], 's') # end


plt.xlim([-2, 8])
plt.savefig('images/phase-portrait-2.png')
plt.show()
>>> ... ... ... [<matplotlib.lines.Line2D object at 0xbc0dbd0>]
[<matplotlib.lines.Line2D object at 0xc135050>]
[<matplotlib.lines.Line2D object at 0xbd1a450>]
[<matplotlib.lines.Line2D object at 0xbd1a1d0>]
[<matplotlib.lines.Line2D object at 0xb88aa10>]
[<matplotlib.lines.Line2D object at 0xb88a5d0>]
[<matplotlib.lines.Line2D object at 0xc14e410>]
[<matplotlib.lines.Line2D object at 0xc14ed90>]
[<matplotlib.lines.Line2D object at 0xc2c5290>]
[<matplotlib.lines.Line2D object at 0xbea4bd0>]
[<matplotlib.lines.Line2D object at 0xbea4d50>]
[<matplotlib.lines.Line2D object at 0xbc401d0>]
[<matplotlib.lines.Line2D object at 0xc2d1190>]
[<matplotlib.lines.Line2D object at 0xc2f3e90>]
[<matplotlib.lines.Line2D object at 0xc2f3bd0>]
[<matplotlib.lines.Line2D object at 0xc2e4790>]
[<matplotlib.lines.Line2D object at 0xc2e0a90>]
[<matplotlib.lines.Line2D object at 0xc2c7390>]
(-2, 8)

What do these figures mean? For starting points near the origin, and small velocities, the pendulum goes into a stable limit cycle. For others, the trajectory appears to fly off into y1 space. Recall that y1 is an angle that has values from \(-\pi\) to \(\pi\). The y1 data in this case is not wrapped around to be in this range.
Copyright (C) 2013 by John Kitchin. See the License for information about copying.