ODEs with discontinuous forcing functions
Posted February 21, 2013 at 09:00 AM | categories: ode | tags:
Updated February 27, 2013 at 02:28 PM
Adapted from http://archives.math.utk.edu/ICTCM/VOL18/S046/paper.pdf
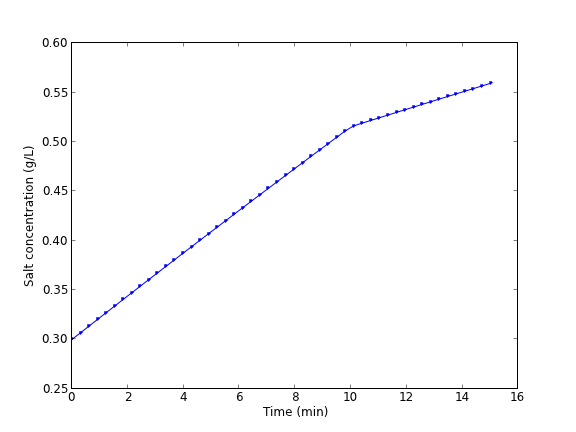
A mixing tank initially contains 300 g of salt mixed into 1000 L of water. At t=0 min, a solution of 4 g/L salt enters the tank at 6 L/min. At t=10 min, the solution is changed to 2 g/L salt, still entering at 6 L/min. The tank is well stirred, and the tank solution leaves at a rate of 6 L/min. Plot the concentration of salt (g/L) in the tank as a function of time.
A mass balance on the salt in the tank leads to this differential equation: \(\frac{dM_S}{dt} = \nu C_{S,in}(t) - \nu M_S/V\) with the initial condition that \(M_S(t=0)=300\). The wrinkle is that the inlet conditions are not constant.
$$C_{S,in}(t) = \begin{array}{ll} 0 & t \le 0, \\ 4 & 0 < t \le 10, \\ 2 & t > 10. \end{array}$$
import numpy as np
from scipy.integrate import odeint
import matplotlib.pyplot as plt

V = 1000.0 # L
nu = 6.0  # L/min

def Cs_in(t):
    'inlet concentration'
    if t < 0:
        Cs = 0.0 # g/L
    elif (t > 0) and (t <= 10):
        Cs = 4.0
    else:
        Cs = 2.0
    return Cs

def mass_balance(Ms, t):
    '$\frac{dM_S}{dt} = \nu C_{S,in}(t) - \nu M_S/V$'
    dMsdt = nu * Cs_in(t) - nu * Ms / V
    return dMsdt

tspan = np.linspace(0.0, 15.0, 50)

M0 = 300.0 # gm salt
Ms = odeint(mass_balance, M0, tspan)

plt.plot(tspan, Ms/V, 'b.-')
plt.xlabel('Time (min)')
plt.ylabel('Salt concentration (g/L)')
plt.savefig('images/ode-discont.png')

You can see the discontinuity in the salt concentration at 10 minutes due to the discontinous change in the entering salt concentration.
Copyright (C) 2013 by John Kitchin. See the License for information about copying.