A new home for the blog

blog
python
The old posts stay where they were. New posts, like this one, run their code locally and store the results.
Author

John Kitchin

Published

October 14, 2026

The blog ran on blogofile for many years, and that software is long past maintained. The 623 posts written with it are still at their original addresses, with their original look, in the archive. New posts live here under /posts/.

Posts are Quarto documents (.qmd) or Jupyter notebooks (.ipynb). Code runs on my machine when I render, and the results are saved with the post, so the site builds without re-running anything.

A small example

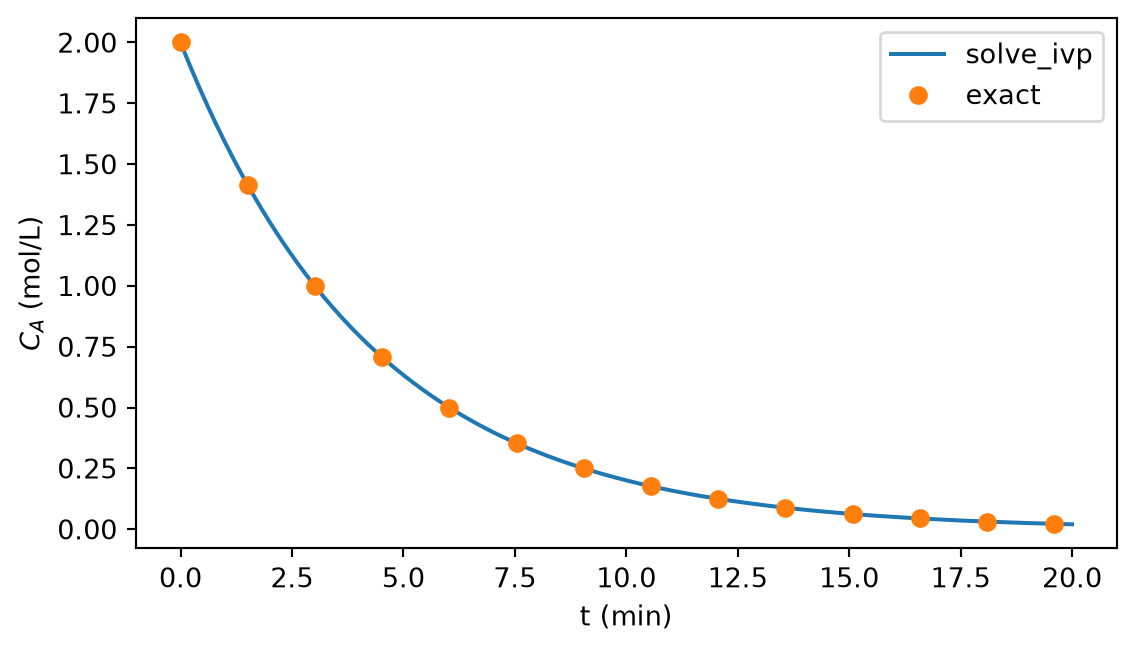
Here is the first-order reaction \(A \rightarrow B\) in a batch reactor, \(\frac{dC_A}{dt} = -k C_A\), solved numerically and compared with the analytical solution.
import numpy as np
from scipy.integrate import solve_ivp

k = 0.23   # 1/min
Ca0 = 2.0  # mol/L

sol = solve_ivp(lambda t, Ca: -k * Ca, (0, 20), [Ca0], dense_output=True)
t = np.linspace(0, 20, 200)
Ca = sol.sol(t)[0]

print(f"C_A(20 min) = {Ca[-1]:.4f} mol/L (exact {Ca0 * np.exp(-k * 20):.4f})")
C_A(20 min) = 0.0201 mol/L (exact 0.0201)
import matplotlib.pyplot as plt

fig, ax = plt.subplots(figsize=(6, 3.5))
ax.plot(t, Ca, label="solve_ivp")
ax.plot(t[::15], Ca0 * np.exp(-k * t[::15]), "o", label="exact")
ax.set_xlabel("t (min)")
ax.set_ylabel("$C_A$ (mol/L)")
ax.legend()
plt.tight_layout()
Line plot of the concentration of A falling exponentially from 2 mol/L toward zero over 20 minutes, with the numerical solution passing through the exact-solution markers.
Figure 1: Concentration of A in a first-order batch reaction.

Figure 1 shows the two agree. Equations, figures and cross-references all come from Quarto, and code blocks have a copy button.