An emacs-lisp dsl for gnuplot
Posted May 04, 2017 at 07:33 PM | categories: emacs, lisp, plotting | tags:
Table of Contents
Plotting is a pretty general feature we need in scientific work. In this post we examine a way we could get at least minimal plotting into Emacs-lisp with as lispy a syntax as reasonable.
1 Embedding Python or gnuplot
With org-mode we can fluidly integrate many languages in one document. That is not the goal here, where I want to integrate plotting into a program. You certainly could go this route to embed python programs in your lisp programs for plotting.
(defun python (code)
  (let* ((temporary-file-directory ".")
        (tmpfile (make-temp-file "py-" nil ".py")))
    (with-temp-file tmpfile
      (insert code))
    (shell-command-to-string (format "python %s" tmpfile))))
Here is that function in action.
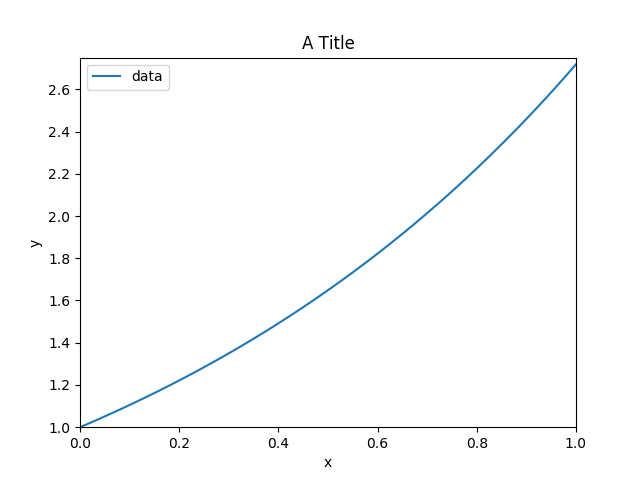
(python "import matplotlib.pyplot as plt
import numpy as np
x = np.linspace(0, 1)
y = np.exp(x)
plt.plot(x, y, label='data')
plt.title('A Title')
plt.xlim([0, 1])
plt.ylim([1, 2.75])
plt.xlabel('x')
plt.ylabel('y')
plt.legend()
plt.savefig('figpy.png')")
And the corresponding figure:

This is irritating for a few reasons. One is it is annoying to write python programs in string form; you don't get much editor support for indentation or syntax highlighting, and you have to be careful with quotes. It is not that easy to switch that snippet to Python mode either. You are pretty limited in writing programs that expand and modify the code too. Basically you have to do that all by string manipulation.
Along these lines, you could imagine a gnuplot function. It ends up not being much better.
(defun gnuplot (cmds)
  (let* ((temporary-file-directory ".")
         (cmdfile (make-temp-file "gnuplot-cmds-" nil ".gpl"))
         (shellcmd (format "gnuplot --persist -c \"%s\"" cmdfile)))
    (with-temp-file cmdfile
      (insert cmds))
    (shell-command shellcmd)
    (delete-file cmdfile)))
You use this the same way.
(gnuplot "set title \"Simple Plots\" font \",20\"
set key left box
set samples 50
set style data points
set terminal png
set output \"gnuplot.png\"

plot [-10:10] sin(x),atan(x),cos(atan(x))")

It has the same limitations as our string-based Python solution. The benefit of them is the native command structure for Python or gnuplot is used, so anything they can do you can too.
2 An alternative approach using a DSL
As an alternative, we consider here a domain specific language (DSL) that maps onto gnuplot. Suppose we could do this instead.
(gnuplot
 (set terminal png)
 (set output "test.png")
 (set title "Simple Plots" font ",20")
 (set key left box)
 (set samples 50)
 (set style data points)

 (plot [-10:10] sin\(x\) \,atan\(x\) \,cos\(atan\(x\)\)))
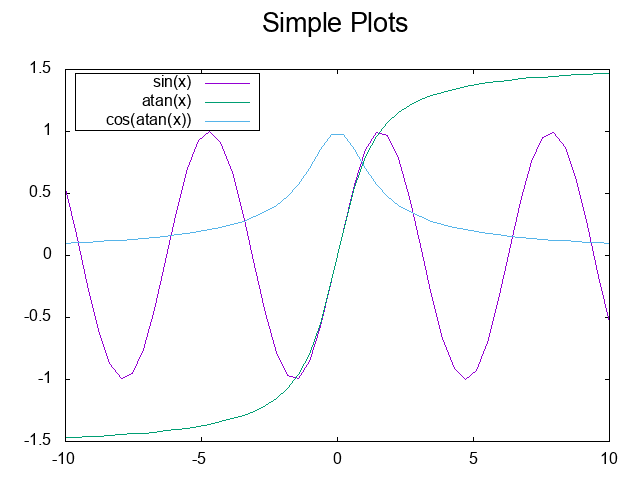
Here is the figure from that code. The most annoying part of this is in the plot function we have to escape all the parentheses and commas, but otherwise it looks pretty lispy. The output of that program is the gnuplot commands that were generated for making the plot.

This retains a lot of benefits of programming in lisp. gnuplot has to be a macro though because we do not want to evaluate the s-expressions inside as lisp. For starters they just look lispy, I don't actually use them as lisp at all. Instead we transform them to the gnuplot code.
In the following code, I will develop the gnuplot macro. It has some sticky and tricky points, and it is not obvious it will support all the features of gnuplot, but I learned a lot doing it that I will share here.
Starting with a simple form inside the macro, I wanted to convert (set output "test.png") to "set output \"test.png\"". For this DSL, I want to treat every symbol in the form as if it should be turned into a string, anything that is a string should be quoted, and anything that is in parentheses (i.e. it passes listp) should be evaluated and converted to a string. Then all those strings should be joined by spaces. Here is a macro that does that (adapted from a solution at https://emacs.stackexchange.com/questions/32558/eval-some-arguments-in-a-macro/32570?noredirect=1#comment50186_32570).
There are a couple of corner cases that are handled here. If the arg is a string, we quote it. If the arg is not a symbol or string, then it is evaluated and converted to a string. Importantly, this is done in the run environment though, so we can inject variables into the gnuplot code.
(defmacro gargs (&rest args)
  "Convert symbols to strings, quote strings, and (expr) to what they evaluate to."
  `(s-join " " (list ,@(cl-mapcan
                        (lambda (s)
                          (list
                           (cond
                            ((symbolp s)
                             (symbol-name s))
                            ((stringp s)
                             (format "\"%s\"" s))
                            (t
                             `(with-output-to-string
                                (princ ,s))))))
                        args))))
Here are a few examples of how it works. The loop is just to get a vertical table in org-mode for the blog post.
(loop for s in
      (list (gargs set key title "before fit" size \, (+ 5 5))
            (gargs set title "red")
            (gargs set yrange [0:*])
            (gargs "5")
            (let ((x 6)) (gargs (identity x)))
            (gargs 'x)
            (gargs '(x))
            (gargs set label 1 "plot for [n=2:10] sin(x*n)/n" at graph .95\, graph .92 right))
      collect
      (list s))
A limitation of this is that we either have quote things like parentheses, commas, semi-colons and sometimes square brackets:
(gargs plot for [n=2:10] sin\(x*n\)/n notitle lw \(13-n\)/2)
Or we have to use the string form instead; we can always fall back to that.
(gargs "plot for [n=2:10] sin(x*n)/n notitle lw (13-n)/2")
The macro above will do the grunt work on each form in the gnuplot macro. Finally, for the gnuplot macro, I want to take all the forms, convert them to gnuplot commands, write them to a temporary file, and then run gnuplot on the file, and finally delete the temp file. I assume we start with a gui terminal so graphs pop up unless you change it in your macro body. Here is that macro. It returns the generated code so it easy to see if you got the right program.
(defmacro gnuplot (&rest forms)
  (let* ((temporary-file-directory ".")
         (cmdfile (make-temp-file "gnuplot-cmds-" nil ".gpl"))
         (shellcmd (format "gnuplot --persist -c \"%s\"" cmdfile))
         (cmd-string))
    `(let ((cmd-string (s-join "\n" (list ,@(mapcar (lambda (x)
                                                      (if (stringp x)
                                                          x
                                                        `(gargs ,@x)))
                                                    forms)))))
       (with-temp-file ,cmdfile
         (insert "set terminal qt\n")
         (insert cmd-string)
         (setq cmd-string (buffer-string)))
       (shell-command ,shellcmd)
       (delete-file ,cmdfile)
       cmd-string)))
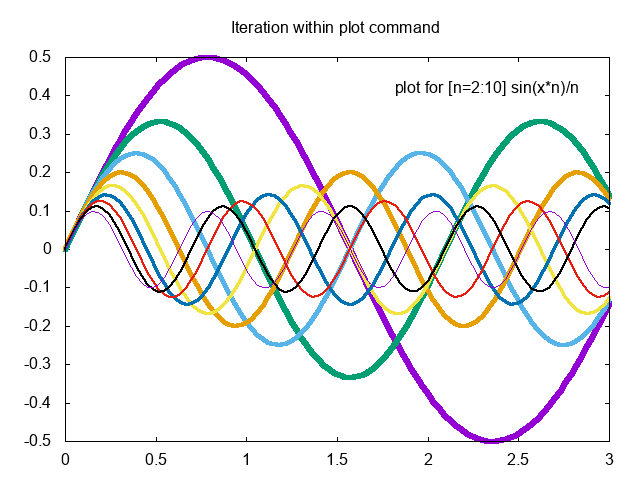
Here is a figure adapted from http://gnuplot.sourceforge.net/demo/iterate.html. I use the string form for the last line to avoid escaping all the special characters.
(gnuplot
 (set terminal png)
 (set output "iteration.png")
 (set title "Iteration within plot command")
 (set xrange [0:3])
 (set label 1 "plot for [n=2:10] sin(x*n)/n" at graph .95\, graph .92 right)
 "plot for [n=2:10] sin(x*n)/n notitle lw (13-n)/2")
Here is the resulting figure.

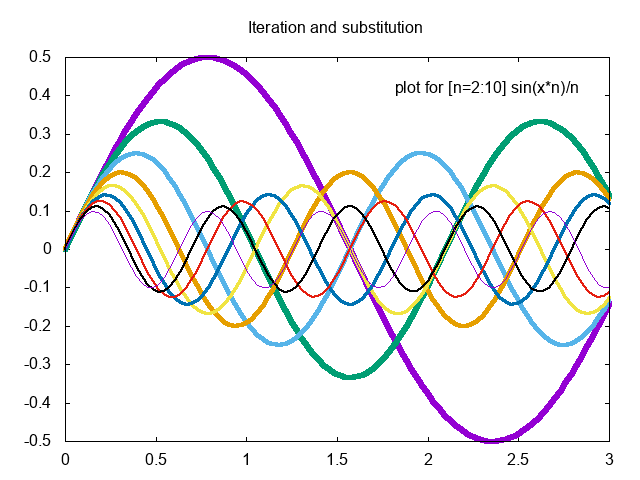
That is overall pretty sweet. There is a little dissonance between the strings, escaped comma, etc.., and it is not terribly ideal for integrating with regular lisp code inside the macro yet. That seems to be a feature of my choice to use (expr) as the syntax to evaluate a form. It means you have to do some gymnastics to get some s-expressions into the graphs. For example below I use a couple of variables to inject values. To get a string I have to use format to add the extra quotes, and to get the number I have to use the identity function. I also used escaped characters in the last line to see the difference.
(let ((ts "Iteration and substitution")
      (x0 0)
      (xf 3)
      (g1 0.95)
      (g2 0.92))
  (gnuplot
   (set terminal png)
   (set output "iteration-2.png")
   (set title (format "\"%s\"" ts))
   ;; Note the escaped square brackets
   (set xrange \[ (identity x0) : (identity xf) \])
   (set label 1 "plot for [n=2:10] sin(x*n)/n" at graph (identity g1) \, graph (identity g2) right)
   ;; note here I escaped the parentheses!
   (plot for [n=2:10] sin\(x*n\)/n notitle lw \(13-n\)/2)))

3 Summary
For the simple plots here, my DSL worked ok. There is a tradeoff in the syntax I chose that has some consequences. We cannot use the values of symbols in this DSL without resorting to hackery like (identity sym). We also cannot use the infix notation for sin(x) without quoting it as "sin(x)" or escaping the parentheses, e.g. sin\(x\), likewise square brackets which lisp will read as a vector. Commas have to be escaped, which is probably an emacs-lisp issue. To address that would require a reader macro which emacs-lisp does not have great support for. I am calling this experiment done for now. I have another syntax idea to try out another day.
Here is a preview of what it might look like. It is basically the same but I reuse keywords to indicate that :x0 should be replaced by whatever x0 evaluates to, and (: - 1 0.05) should be evaluated. The special character escaping is still there of course, since that is a limitation of the emacs lisp reader I think. I might try using x0? and (? - 1 0.05) instead. That might be less confusing. I like that the keywords are syntax highlighted for free though, and you can't use them for anything else.
(let ((ts "Iteration and substitution")
      (x0 0)
      (xf 3)
      (g2 0.92))
  (gnuplot
   (set terminal png)
   (set output "iteration-2.png")
   (set title :ts)
   ;; Note the escaped square brackets
   (set xrange \[ :x0 : :xf \])
   (set label 1 "plot for [n=2:10] sin(x*n)/n" at graph (: - 1 0.05) \, graph :g2 right)
   ;; note here I escaped the parentheses!
   (plot for [n=2:10] sin(x*n)/n notitle lw (13-n)/2)))
This has the benefit of a little cleaner injection of variables and selective execution of parenthetical expressions, we will just ignore any that don't pass (= (car expr) :). That May not work for sin((: + 1 1) x) though, unless I escape the outer parentheses too.
Copyright (C) 2017 by John Kitchin. See the License for information about copying.
Org-mode version = 9.0.5