Hatched symbols in matplotlib
Posted October 26, 2013 at 02:35 PM | categories: plotting | tags:
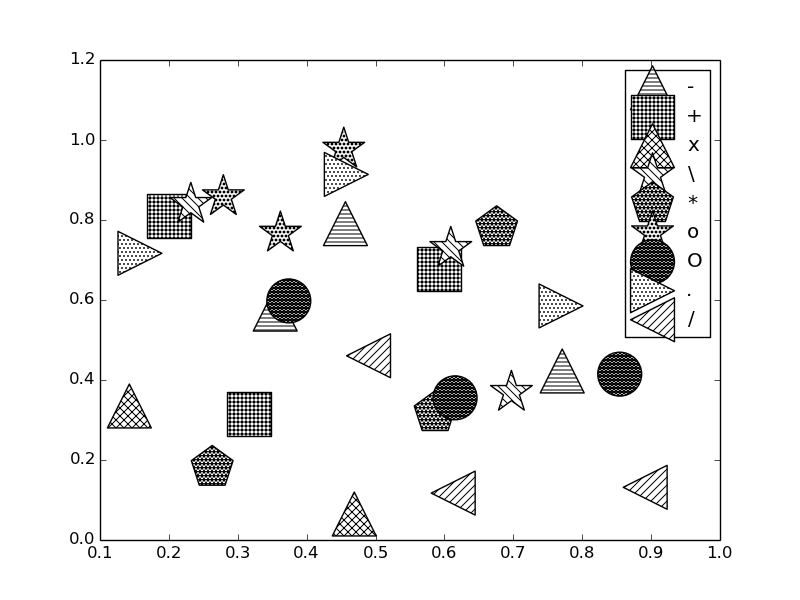
I learned something new about matplotlib today: How to make hatched (patterned) symbols in a plot. Well, sort of. The scatter plot in matplotlib has a hatch keyword argument that specifies a pattern on the marker. Below, is an example that runs through a handful of hatch patterns, on randomly selected symbols.
Curiously, hatch is not a kwarg of the scatter function, but of collections . Anyway, let us see how to get the hatched symbols.
import random
import numpy as np
import matplotlib.pyplot as plt

patterns = ('-', '+', 'x', '\\', '*', 'o', 'O', '.', '/')
markers = 'os<^>p*'
for pattern in patterns:
    plt.scatter(np.random.uniform(size=(3,1)), np.random.uniform(size=(3,1)), s=1000,
                marker=random.choice(markers),
                facecolor='white',
                hatch=3*pattern, label=pattern)

plt.legend(scatterpoints=1, loc='best')
plt.savefig('images/hatched-symbols.png')
There are some other interesting things you can do with filled markers , hatched contours and with hatched bar graphs . Note this hatching is specific to plt.scatter. It does not work with plt.plot.
Copyright (C) 2013 by John Kitchin. See the License for information about copying.