Fit a line to numerical data
Posted February 18, 2013 at 09:00 AM | categories: data analysis | tags:
Updated February 27, 2013 at 02:38 PM
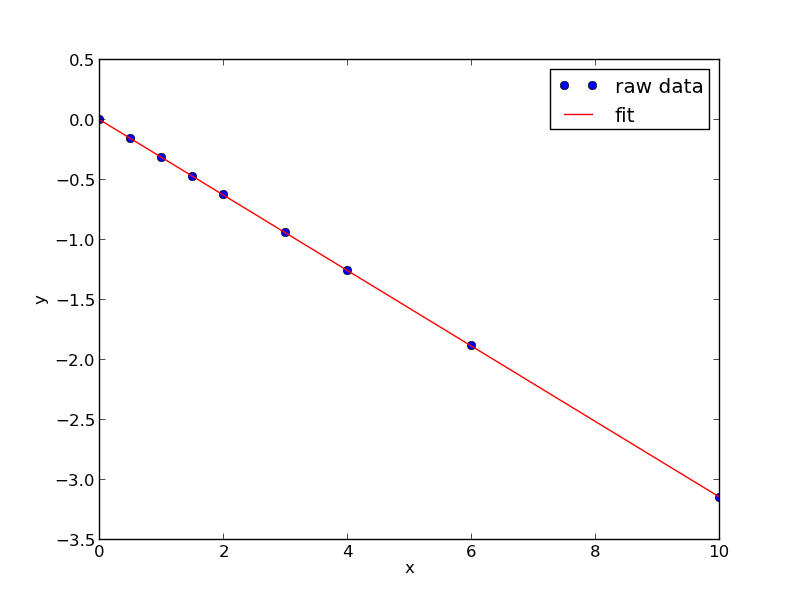
We want to fit a line to this data:
x = [0, 0.5, 1, 1.5, 2.0, 3.0, 4.0, 6.0, 10]
y = [0, -0.157, -0.315, -0.472, -0.629, -0.942, -1.255, -1.884, -3.147]
We use the polyfit(x, y, n) command where n is the polynomial order, n=1 for a line.
import numpy as np

p = np.polyfit(x, y, 1)
print p
slope, intercept = p
print slope, intercept
>>> >>> [-0.31452218  0.00062457]
>>> -0.3145221843 0.00062457337884
To show the fit, we can use numpy.polyval to evaluate the fit at many points.
import matplotlib.pyplot as plt

xfit = np.linspace(0, 10)
yfit = np.polyval(p, xfit)

plt.plot(x, y, 'bo', label='raw data')
plt.plot(xfit, yfit, 'r-', label='fit')
plt.xlabel('x')
plt.ylabel('y')
plt.legend()
plt.savefig('images/linefit-1.png')
>>> >>> >>> >>> [<matplotlib.lines.Line2D object at 0x053C1790>]
[<matplotlib.lines.Line2D object at 0x0313C610>]
<matplotlib.text.Text object at 0x052A4950>
<matplotlib.text.Text object at 0x052B9A10>
<matplotlib.legend.Legend object at 0x053C1CD0>
Copyright (C) 2013 by John Kitchin. See the License for information about copying.